

interactions inside the substrate binding tunnel, and the cap group interacts with
residues at the rim of the binding pocket [24, 25].
Crystal structures of protein-ligand complexes represent the basic source of
structural information for inhibitor optimization and for identification of novel
hits. In early studies, the first solved HDAC crystal structure of bacterial HDAClike protein was readily used for docking and structure-based optimization of
inhibitors [28–36]. In the absence of the target protein structure, homology modeling
was applied. Homology models of HDAC1 and HDAC6 have been often generated
and used to predict the binding modes of inhibitors [37–48]. VS has been a major
N
H
N
O
N
H
O
OH
N
H
O
OH
S
N
N
F 3 C
N
H
O
OH
S
N
N
N
H
N
S
N
N
N
H
S
O
O
N
H
S
O
S
N
H
O
N
H
O
OH
N
H
S
Cl
O
OH
N
H
O
OH
O
N
H
O
1
2
3
4
5
6
7
9
12
N
H
O
N
N
OH
N
H
O
OH
N
H
N
H
N
H
O
OH
N
H
O
8
N
H
O
OH
O
N
H
10
N
H
O
OH
O
O
11
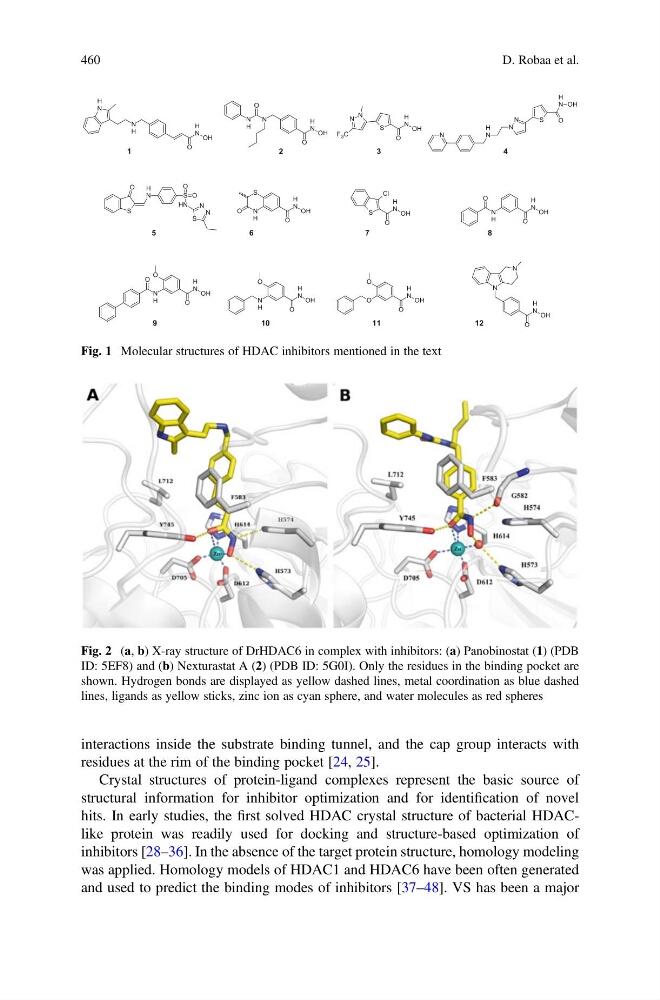
Fig. 1 Molecular structures of HDAC inhibitors mentioned in the text
Fig. 2 (a, b) X-ray structure of DrHDAC6 in complex with inhibitors: (a) Panobinostat (1) (PDB
ID: 5EF8) and (b) Nexturastat A (2) (PDB ID: 5G0I). Only the residues in the binding pocket are
shown. Hydrogen bonds are displayed as yellow dashed lines, metal coordination as blue dashed
lines, ligands as yellow sticks, zinc ion as cyan sphere, and water molecules as red spheres
460
D. Robaa et al.
residues at the rim of the binding pocket [24, 25].
Crystal structures of protein-ligand complexes represent the basic source of
structural information for inhibitor optimization and for identification of novel
hits. In early studies, the first solved HDAC crystal structure of bacterial HDAClike protein was readily used for docking and structure-based optimization of
inhibitors [28–36]. In the absence of the target protein structure, homology modeling
was applied. Homology models of HDAC1 and HDAC6 have been often generated
and used to predict the binding modes of inhibitors [37–48]. VS has been a major
N
H
N
O
N
H
O
OH
N
H
O
OH
S
N
N
F 3 C
N
H
O
OH
S
N
N
N
H
N
S
N
N
N
H
S
O
O
N
H
S
O
S
N
H
O
N
H
O
OH
N
H
S
Cl
O
OH
N
H
O
OH
O
N
H
O
1
2
3
4
5
6
7
9
12
N
H
O
N
N
OH
N
H
O
OH
N
H
N
H
N
H
O
OH
N
H
O
8
N
H
O
OH
O
N
H
10
N
H
O
OH
O
O
11
Fig. 1 Molecular structures of HDAC inhibitors mentioned in the text
Fig. 2 (a, b) X-ray structure of DrHDAC6 in complex with inhibitors: (a) Panobinostat (1) (PDB
ID: 5EF8) and (b) Nexturastat A (2) (PDB ID: 5G0I). Only the residues in the binding pocket are
shown. Hydrogen bonds are displayed as yellow dashed lines, metal coordination as blue dashed
lines, ligands as yellow sticks, zinc ion as cyan sphere, and water molecules as red spheres
460
D. Robaa et al.