

79
Water, included under MDG 7, was given Target 7.C, to “halve, by 2015, the
proportion of people without sustainable access to safe drinking water and basic
sanitation.” Two metrics were ultimately adopted to measure progress toward
this target:
7.8 Proportion of population using an improved drinking water source
7.9 Proportion of population using an improved sanitation facility
The two metrics for water are also utilization metrics (using an improved drinking
water source and using an improved sanitation facility).
3.5.2 Outcomes for Food and Water 2000–2015
Before assessing the impact of the Millennium Development Goals, we will look at
the four metrics over the period of 2000–2015.
3.5.2.1 Prevalence of Underweight Children Under 5 Years of Age
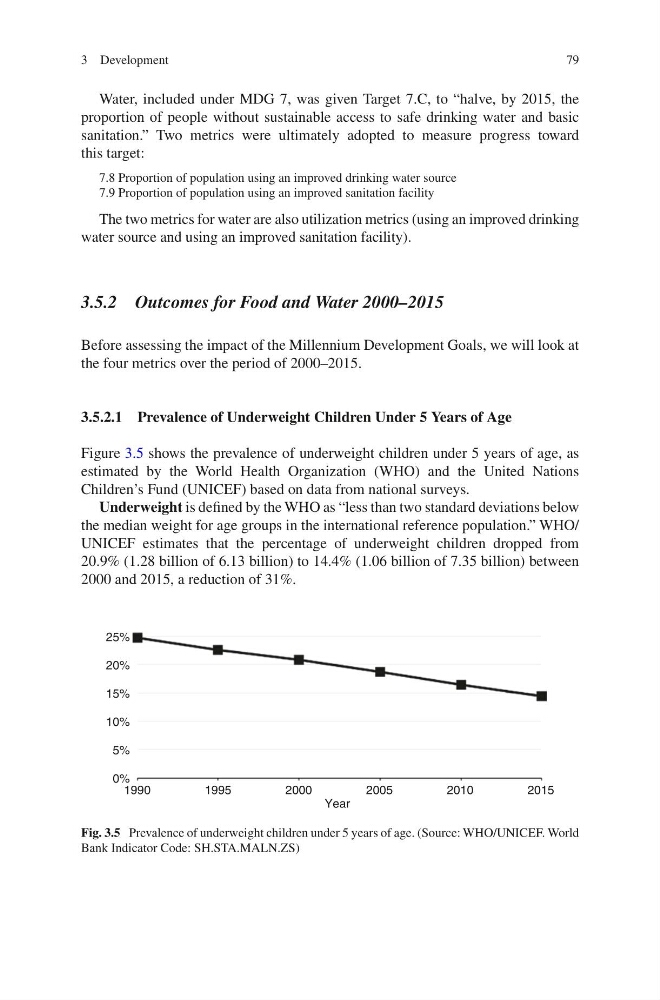
Figure 3.5 shows the prevalence of underweight children under 5 years of age, as
estimated by the World Health Organization (WHO) and the United Nations
Children’s Fund (UNICEF) based on data from national surveys.
Underweight is defined by the WHO as “less than two standard deviations below
the median weight for age groups in the international reference population.” WHO/
UNICEF estimates that the percentage of underweight children dropped from
20.9% (1.28 billion of 6.13 billion) to 14.4% (1.06 billion of 7.35 billion) between
2000 and 2015, a reduction of 31%.
0%
1990
1995
2000
Year
2005
2010
2015
5%
10%
15%
20%
25%
Fig. 3.5 Prevalence of underweight children under 5 years of age. (Source: WHO/UNICEF. World
Bank Indicator Code: SH.STA.MALN.ZS)
3 Development
Water, included under MDG 7, was given Target 7.C, to “halve, by 2015, the
proportion of people without sustainable access to safe drinking water and basic
sanitation.” Two metrics were ultimately adopted to measure progress toward
this target:
7.8 Proportion of population using an improved drinking water source
7.9 Proportion of population using an improved sanitation facility
The two metrics for water are also utilization metrics (using an improved drinking
water source and using an improved sanitation facility).
3.5.2 Outcomes for Food and Water 2000–2015
Before assessing the impact of the Millennium Development Goals, we will look at
the four metrics over the period of 2000–2015.
3.5.2.1 Prevalence of Underweight Children Under 5 Years of Age
Figure 3.5 shows the prevalence of underweight children under 5 years of age, as
estimated by the World Health Organization (WHO) and the United Nations
Children’s Fund (UNICEF) based on data from national surveys.
Underweight is defined by the WHO as “less than two standard deviations below
the median weight for age groups in the international reference population.” WHO/
UNICEF estimates that the percentage of underweight children dropped from
20.9% (1.28 billion of 6.13 billion) to 14.4% (1.06 billion of 7.35 billion) between
2000 and 2015, a reduction of 31%.
0%
1990
1995
2000
Year
2005
2010
2015
5%
10%
15%
20%
25%
Fig. 3.5 Prevalence of underweight children under 5 years of age. (Source: WHO/UNICEF. World
Bank Indicator Code: SH.STA.MALN.ZS)
3 Development