

465
employed to characterize the movement of water within the system and across system boundaries, as well as the forces that drive FEW system demands. Collectively,
this information describes the physical conditions that largely control crop growth,
dictate irrigation demand, inform crop management decisions, define thermoelectric energy requirements, and constrain biofuel production rates.
The ground-based observations used in the characterization of water availability
across the world are available through the World Meteorological Organization (https://
www.wmo.int) and the Automated Surface Observing System (http://www.nws.noaa.
gov/asos/). In the absence of groundwater measurements, satellite-based gravimetric
measurements from the Gravity Recovery and Climate Experiment (GRACE) can be
used. Preliminary research using the GRACE satellites indicates a far more severe
decline in global groundwater budgets than has been previously estimated.
Preliminary results demonstrate a high degree of agreement with ground-based
observations (i.e., correlation greater than 0.88) and suggest GRACE measurements
contain information related to groundwater storage changes. A suite of reanalysis
products (e.g., MERRA-Land, MEERA-2, Land Information System, NLDAS2)
provide additional information about groundwater and surface water storage. In
addition to ground-based observations, satellite-based soil moisture and snow depth
retrievals from passive microwave sensors are available from 1979 onwards.
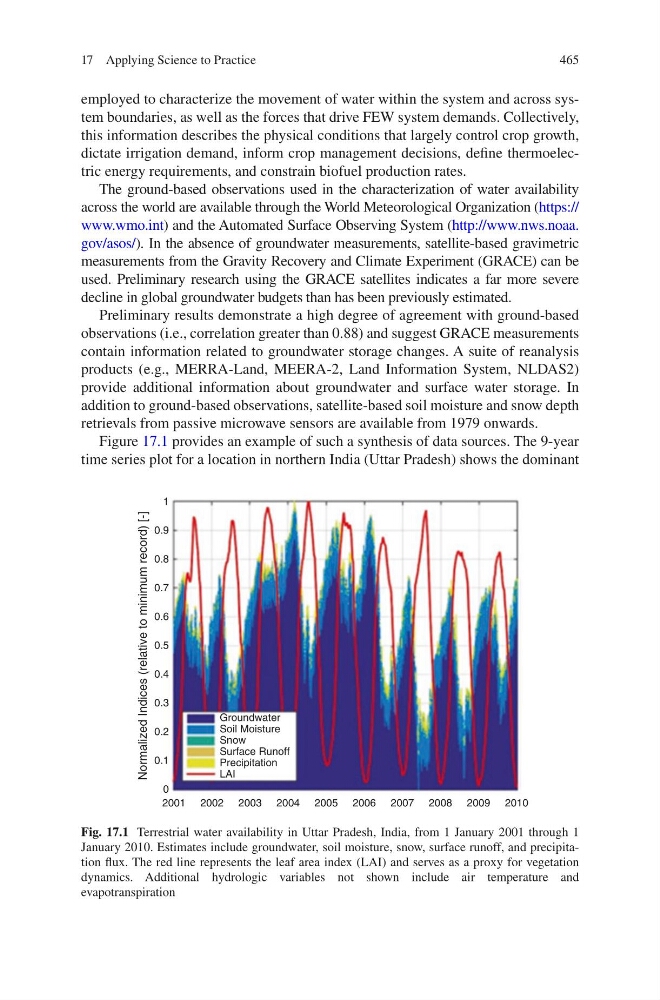
Figure 17.1 provides an example of such a synthesis of data sources. The 9-year
time series plot for a location in northern India (Uttar Pradesh) shows the dominant
1
0.9
0.8
0.7
0.6
0.5
0.4
0.3
0.2
0.1
0
2001 2002 2003
Groundwater
Normalized Indices (relative to minimum record) [-]
Soil Moisture
Snow
Surface Runoff
Precipitation
LAI
2004 2005 2006 2007 2008 2009 2010
Fig. 17.1 Terrestrial water availability in Uttar Pradesh, India, from 1 January 2001 through 1
January 2010. Estimates include groundwater, soil moisture, snow, surface runoff, and precipitation flux. The red line represents the leaf area index (LAI) and serves as a proxy for vegetation
dynamics. Additional hydrologic variables not shown include air temperature and
evapotranspiration
17 Applying Science to Practice
employed to characterize the movement of water within the system and across system boundaries, as well as the forces that drive FEW system demands. Collectively,
this information describes the physical conditions that largely control crop growth,
dictate irrigation demand, inform crop management decisions, define thermoelectric energy requirements, and constrain biofuel production rates.
The ground-based observations used in the characterization of water availability
across the world are available through the World Meteorological Organization (https://
www.wmo.int) and the Automated Surface Observing System (http://www.nws.noaa.
gov/asos/). In the absence of groundwater measurements, satellite-based gravimetric
measurements from the Gravity Recovery and Climate Experiment (GRACE) can be
used. Preliminary research using the GRACE satellites indicates a far more severe
decline in global groundwater budgets than has been previously estimated.
Preliminary results demonstrate a high degree of agreement with ground-based
observations (i.e., correlation greater than 0.88) and suggest GRACE measurements
contain information related to groundwater storage changes. A suite of reanalysis
products (e.g., MERRA-Land, MEERA-2, Land Information System, NLDAS2)
provide additional information about groundwater and surface water storage. In
addition to ground-based observations, satellite-based soil moisture and snow depth
retrievals from passive microwave sensors are available from 1979 onwards.
Figure 17.1 provides an example of such a synthesis of data sources. The 9-year
time series plot for a location in northern India (Uttar Pradesh) shows the dominant
1
0.9
0.8
0.7
0.6
0.5
0.4
0.3
0.2
0.1
0
2001 2002 2003
Groundwater
Normalized Indices (relative to minimum record) [-]
Soil Moisture
Snow
Surface Runoff
Precipitation
LAI
2004 2005 2006 2007 2008 2009 2010
Fig. 17.1 Terrestrial water availability in Uttar Pradesh, India, from 1 January 2001 through 1
January 2010. Estimates include groundwater, soil moisture, snow, surface runoff, and precipitation flux. The red line represents the leaf area index (LAI) and serves as a proxy for vegetation
dynamics. Additional hydrologic variables not shown include air temperature and
evapotranspiration
17 Applying Science to Practice