

443
the tool is assumed to be consistent over time. In other words, if the conditions
change over time, the generated model may not reflect the actual case. For
example, a model that is created for climate conditions of a specific agricultural
field may not reflect the present conditions of the field due to climate change
and therefore may cause incorrect future projections. Thus, there is a need for
tools that will adapt the model to changes over time.
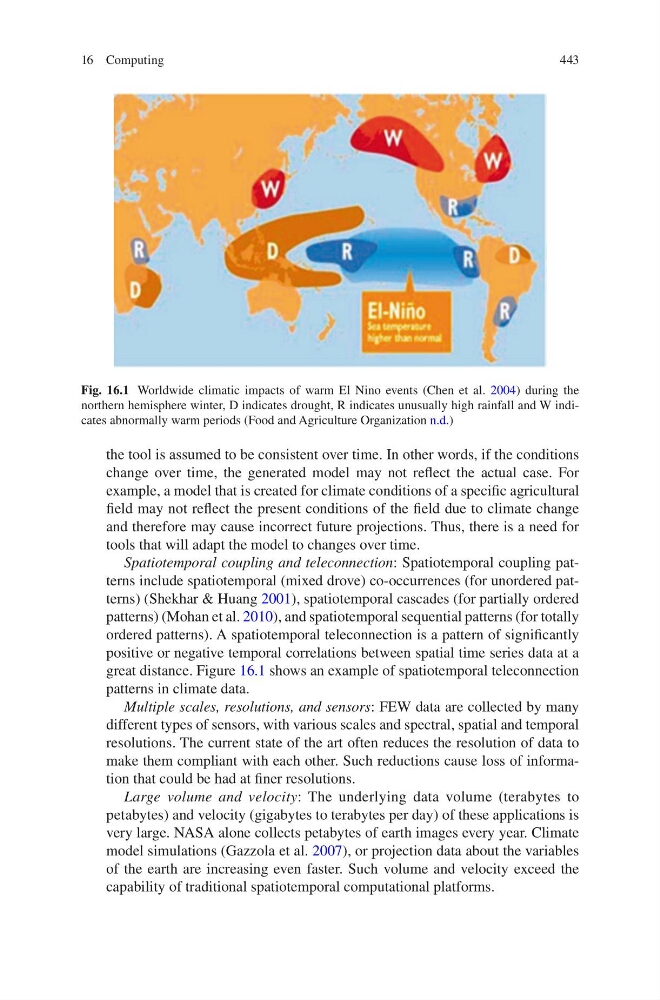
Spatiotemporal coupling and teleconnection: Spatiotemporal coupling patterns include spatiotemporal (mixed drove) co-occurrences (for unordered patterns) (Shekhar & Huang 2001), spatiotemporal cascades (for partially ordered
patterns) (Mohan et al. 2010), and spatiotemporal sequential patterns (for totally
ordered patterns). A spatiotemporal teleconnection is a pattern of significantly
positive or negative temporal correlations between spatial time series data at a
great distance. Figure 16.1 shows an example of spatiotemporal teleconnection
patterns in climate data.
Multiple scales, resolutions, and sensors: FEW data are collected by many
different types of sensors, with various scales and spectral, spatial and temporal
resolutions. The current state of the art often reduces the resolution of data to
make them compliant with each other. Such reductions cause loss of information that could be had at finer resolutions.
Large volume and velocity: The underlying data volume (terabytes to
petabytes) and velocity (gigabytes to terabytes per day) of these applications is
very large. NASA alone collects petabytes of earth images every year. Climate
model simulations (Gazzola et al. 2007), or projection data about the variables
of the earth are increasing even faster. Such volume and velocity exceed the
capability of traditional spatiotemporal computational platforms.
Fig. 16.1 Worldwide climatic impacts of warm El Nino events (Chen et al. 2004) during the
northern hemisphere winter, D indicates drought, R indicates unusually high rainfall and W indicates abnormally warm periods (Food and Agriculture Organization n.d.)
16 Computing
the tool is assumed to be consistent over time. In other words, if the conditions
change over time, the generated model may not reflect the actual case. For
example, a model that is created for climate conditions of a specific agricultural
field may not reflect the present conditions of the field due to climate change
and therefore may cause incorrect future projections. Thus, there is a need for
tools that will adapt the model to changes over time.
Spatiotemporal coupling and teleconnection: Spatiotemporal coupling patterns include spatiotemporal (mixed drove) co-occurrences (for unordered patterns) (Shekhar & Huang 2001), spatiotemporal cascades (for partially ordered
patterns) (Mohan et al. 2010), and spatiotemporal sequential patterns (for totally
ordered patterns). A spatiotemporal teleconnection is a pattern of significantly
positive or negative temporal correlations between spatial time series data at a
great distance. Figure 16.1 shows an example of spatiotemporal teleconnection
patterns in climate data.
Multiple scales, resolutions, and sensors: FEW data are collected by many
different types of sensors, with various scales and spectral, spatial and temporal
resolutions. The current state of the art often reduces the resolution of data to
make them compliant with each other. Such reductions cause loss of information that could be had at finer resolutions.
Large volume and velocity: The underlying data volume (terabytes to
petabytes) and velocity (gigabytes to terabytes per day) of these applications is
very large. NASA alone collects petabytes of earth images every year. Climate
model simulations (Gazzola et al. 2007), or projection data about the variables
of the earth are increasing even faster. Such volume and velocity exceed the
capability of traditional spatiotemporal computational platforms.
Fig. 16.1 Worldwide climatic impacts of warm El Nino events (Chen et al. 2004) during the
northern hemisphere winter, D indicates drought, R indicates unusually high rainfall and W indicates abnormally warm periods (Food and Agriculture Organization n.d.)
16 Computing