

369
4. Discuss some limitations with the use of life cycle assessment for identifying
metrics of interest.
5. Identify examples where spatial and temporal scales impact the specification of
appropriate metrics.
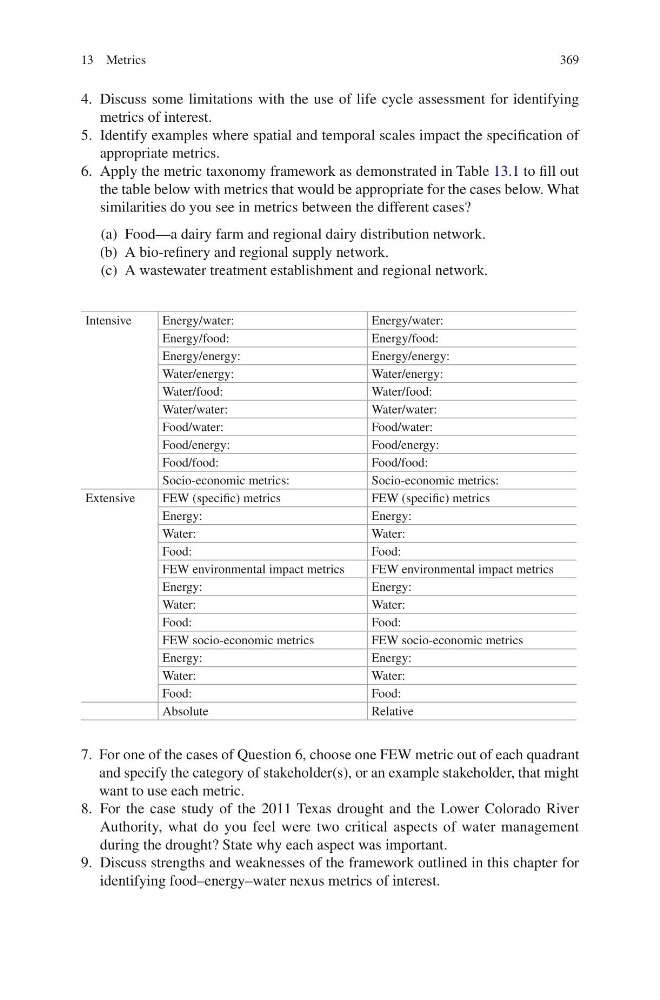
6. Apply the metric taxonomy framework as demonstrated in Table 13.1 to fill out
the table below with metrics that would be appropriate for the cases below. What
similarities do you see in metrics between the different cases?
(a) Food—a dairy farm and regional dairy distribution network.
(b) A bio-refinery and regional supply network.
(c) A wastewater treatment establishment and regional network.
Intensive
Energy/water:
Energy/water:
Energy/food:
Energy/food:
Energy/energy:
Energy/energy:
Water/energy:
Water/energy:
Water/food:
Water/food:
Water/water:
Water/water:
Food/water:
Food/water:
Food/energy:
Food/energy:
Food/food:
Food/food:
Socio-economic metrics:
Socio-economic metrics:
Extensive
FEW (specific) metrics
FEW (specific) metrics
Energy:
Energy:
Water:
Water:
Food:
Food:
FEW environmental impact metrics
FEW environmental impact metrics
Energy:
Energy:
Water:
Water:
Food:
Food:
FEW socio-economic metrics
FEW socio-economic metrics
Energy:
Energy:
Water:
Water:
Food:
Food:
Absolute
Relative
7. For one of the cases of Question 6, choose one FEW metric out of each quadrant
and specify the category of stakeholder(s), or an example stakeholder, that might
want to use each metric.
8. For the case study of the 2011 Texas drought and the Lower Colorado River
Authority, what do you feel were two critical aspects of water management
during the drought? State why each aspect was important.
9. Discuss strengths and weaknesses of the framework outlined in this chapter for
identifying food–energy–water nexus metrics of interest.
13 Metrics
4. Discuss some limitations with the use of life cycle assessment for identifying
metrics of interest.
5. Identify examples where spatial and temporal scales impact the specification of
appropriate metrics.
6. Apply the metric taxonomy framework as demonstrated in Table 13.1 to fill out
the table below with metrics that would be appropriate for the cases below. What
similarities do you see in metrics between the different cases?
(a) Food—a dairy farm and regional dairy distribution network.
(b) A bio-refinery and regional supply network.
(c) A wastewater treatment establishment and regional network.
Intensive
Energy/water:
Energy/water:
Energy/food:
Energy/food:
Energy/energy:
Energy/energy:
Water/energy:
Water/energy:
Water/food:
Water/food:
Water/water:
Water/water:
Food/water:
Food/water:
Food/energy:
Food/energy:
Food/food:
Food/food:
Socio-economic metrics:
Socio-economic metrics:
Extensive
FEW (specific) metrics
FEW (specific) metrics
Energy:
Energy:
Water:
Water:
Food:
Food:
FEW environmental impact metrics
FEW environmental impact metrics
Energy:
Energy:
Water:
Water:
Food:
Food:
FEW socio-economic metrics
FEW socio-economic metrics
Energy:
Energy:
Water:
Water:
Food:
Food:
Absolute
Relative
7. For one of the cases of Question 6, choose one FEW metric out of each quadrant
and specify the category of stakeholder(s), or an example stakeholder, that might
want to use each metric.
8. For the case study of the 2011 Texas drought and the Lower Colorado River
Authority, what do you feel were two critical aspects of water management
during the drought? State why each aspect was important.
9. Discuss strengths and weaknesses of the framework outlined in this chapter for
identifying food–energy–water nexus metrics of interest.
13 Metrics