

251
boxes, etc.) and reutilising waste in order to produce as little left-over waste as possible minimising in this way environmental effects.
The model encourages the planning of the
production of durable products, preparations are
made in order to be able to make renewable products usable again and a cheap servicing network
is operated to repair small faults. When the given
product reaches the end of its life cycle, basic
material composing the product is extracted and
reused. The extraction of the often valuable basic
material (e.g., in electric devices) decomposing
workshops and professional technicians might be
required.
Circular economy—if circular production and
consumption are organised well—could reduce
environmental effects significantly and could create new jobs contributing also to achieving sustainable development. It is also possible that the
processing of recycled material requires too
much energy and, in that case, environmental
profit cannot be guaranteed. Therefore the application of circular economy has to be preceded by
a detailed analysis of production, transport and
reutilisation procedures.
The current economic model prevailing globally is not considered sustainable as it takes no
account of the limits of nature. Gardner and
Prugh (2008) together with Talberth (2008)
think that GDP, the economic “development”
(growth) indicator considered to be the most
fundamental today, is not acceptable because it
does not indicate sustainability and gives no
account of the exhaustibility and depletion of
either humane or natural capital. Neither the
cost of environmental pollution and deterioration nor market-like profits originated from the
gifts of nature are indicated. At the same time,
war costs are calculated as contributing to
increasing welfare.
In order to achieve sustainable development
fast and feasible transformation of the society is
required, the aim of which is improvement in the
welfare of humanity. Economic progress can be
measured on the basis of how high level of living
standard can be achieved at the expense of how
little consumption (Talberth 2008). Wide employment of genuine progress indicator (GPI) may
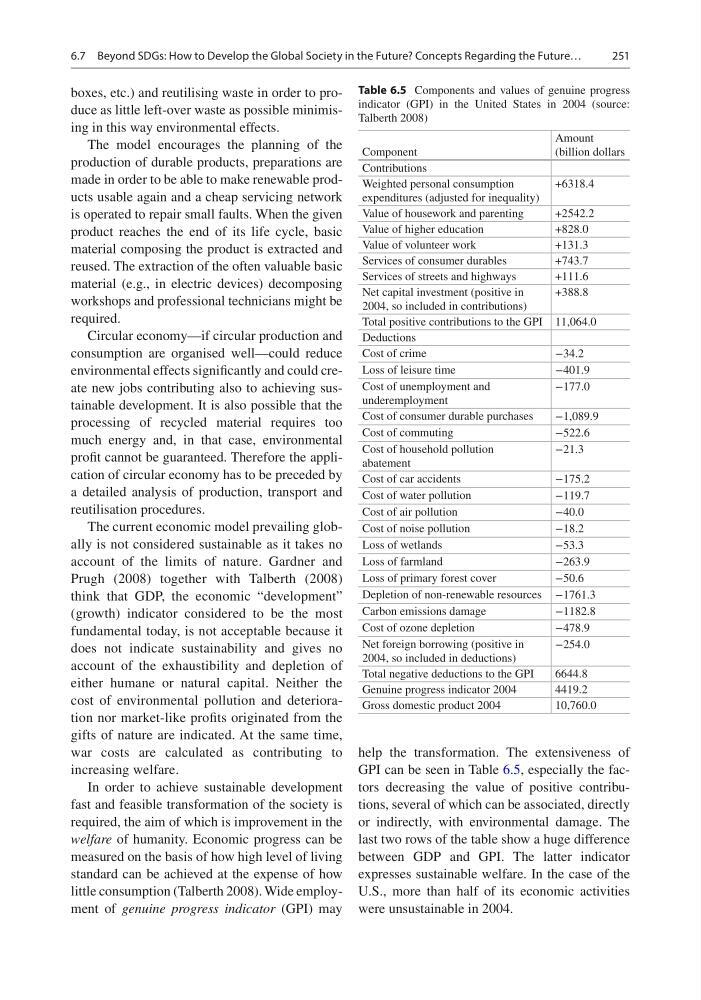
help the transformation. The extensiveness of
GPI can be seen in Table 6.5, especially the factors decreasing the value of positive contributions, several of which can be associated, directly
or indirectly, with environmental damage. The
last two rows of the table show a huge difference
between GDP and GPI. The latter indicator
expresses sustainable welfare. In the case of the
U.S., more than half of its economic activities
were unsustainable in 2004.
Table 6.5 Components and values of genuine progress
indicator (GPI) in the United States in 2004 (source:
Talberth 2008)
Component
Amount
(billion dollars
Contributions
Weighted personal consumption
expenditures (adjusted for inequality)
+6318.4
Value of housework and parenting
+2542.2
Value of higher education
+828.0
Value of volunteer work
+131.3
Services of consumer durables
+743.7
Services of streets and highways
+111.6
Net capital investment (positive in
2004, so included in contributions)
+388.8
Total positive contributions to the GPI 11,064.0
Deductions
Cost of crime
−34.2
Loss of leisure time
−401.9
Cost of unemployment and
underemployment
−177.0
Cost of consumer durable purchases
−1,089.9
Cost of commuting
−522.6
Cost of household pollution
abatement
−21.3
Cost of car accidents
−175.2
Cost of water pollution
−119.7
Cost of air pollution
−40.0
Cost of noise pollution
−18.2
Loss of wetlands
−53.3
Loss of farmland
−263.9
Loss of primary forest cover
−50.6
Depletion of non-renewable resources −1761.3
Carbon emissions damage
−1182.8
Cost of ozone depletion
−478.9
Net foreign borrowing (positive in
2004, so included in deductions)
−254.0
Total negative deductions to the GPI
6644.8
Genuine progress indicator 2004
4419.2
Gross domestic product 2004
10,760.0
6.7 Beyond SDGs: How to Develop the Global Society in the Future? Concepts Regarding the Future…
boxes, etc.) and reutilising waste in order to produce as little left-over waste as possible minimising in this way environmental effects.
The model encourages the planning of the
production of durable products, preparations are
made in order to be able to make renewable products usable again and a cheap servicing network
is operated to repair small faults. When the given
product reaches the end of its life cycle, basic
material composing the product is extracted and
reused. The extraction of the often valuable basic
material (e.g., in electric devices) decomposing
workshops and professional technicians might be
required.
Circular economy—if circular production and
consumption are organised well—could reduce
environmental effects significantly and could create new jobs contributing also to achieving sustainable development. It is also possible that the
processing of recycled material requires too
much energy and, in that case, environmental
profit cannot be guaranteed. Therefore the application of circular economy has to be preceded by
a detailed analysis of production, transport and
reutilisation procedures.
The current economic model prevailing globally is not considered sustainable as it takes no
account of the limits of nature. Gardner and
Prugh (2008) together with Talberth (2008)
think that GDP, the economic “development”
(growth) indicator considered to be the most
fundamental today, is not acceptable because it
does not indicate sustainability and gives no
account of the exhaustibility and depletion of
either humane or natural capital. Neither the
cost of environmental pollution and deterioration nor market-like profits originated from the
gifts of nature are indicated. At the same time,
war costs are calculated as contributing to
increasing welfare.
In order to achieve sustainable development
fast and feasible transformation of the society is
required, the aim of which is improvement in the
welfare of humanity. Economic progress can be
measured on the basis of how high level of living
standard can be achieved at the expense of how
little consumption (Talberth 2008). Wide employment of genuine progress indicator (GPI) may
help the transformation. The extensiveness of
GPI can be seen in Table 6.5, especially the factors decreasing the value of positive contributions, several of which can be associated, directly
or indirectly, with environmental damage. The
last two rows of the table show a huge difference
between GDP and GPI. The latter indicator
expresses sustainable welfare. In the case of the
U.S., more than half of its economic activities
were unsustainable in 2004.
Table 6.5 Components and values of genuine progress
indicator (GPI) in the United States in 2004 (source:
Talberth 2008)
Component
Amount
(billion dollars
Contributions
Weighted personal consumption
expenditures (adjusted for inequality)
+6318.4
Value of housework and parenting
+2542.2
Value of higher education
+828.0
Value of volunteer work
+131.3
Services of consumer durables
+743.7
Services of streets and highways
+111.6
Net capital investment (positive in
2004, so included in contributions)
+388.8
Total positive contributions to the GPI 11,064.0
Deductions
Cost of crime
−34.2
Loss of leisure time
−401.9
Cost of unemployment and
underemployment
−177.0
Cost of consumer durable purchases
−1,089.9
Cost of commuting
−522.6
Cost of household pollution
abatement
−21.3
Cost of car accidents
−175.2
Cost of water pollution
−119.7
Cost of air pollution
−40.0
Cost of noise pollution
−18.2
Loss of wetlands
−53.3
Loss of farmland
−263.9
Loss of primary forest cover
−50.6
Depletion of non-renewable resources −1761.3
Carbon emissions damage
−1182.8
Cost of ozone depletion
−478.9
Net foreign borrowing (positive in
2004, so included in deductions)
−254.0
Total negative deductions to the GPI
6644.8
Genuine progress indicator 2004
4419.2
Gross domestic product 2004
10,760.0
6.7 Beyond SDGs: How to Develop the Global Society in the Future? Concepts Regarding the Future…