

118
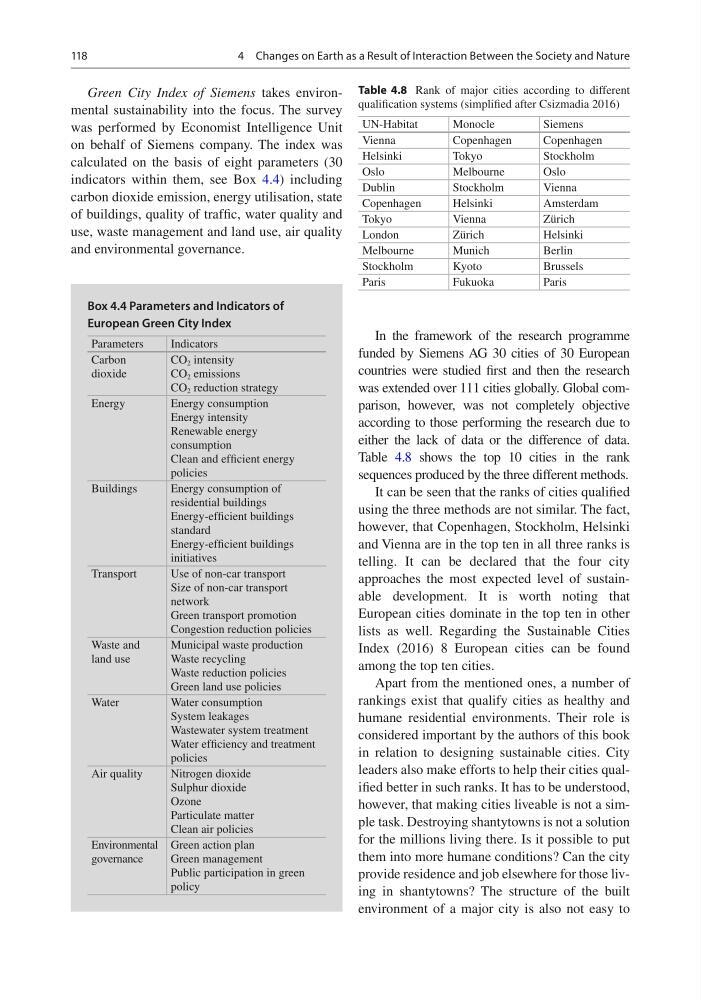
Green City Index of Siemens takes environmental sustainability into the focus. The survey
was performed by Economist Intelligence Unit
on behalf of Siemens company. The index was
calculated on the basis of eight parameters (30
indicators within them, see Box 4.4) including
carbon dioxide emission, energy utilisation, state
of buildings, quality of traffic, water quality and
use, waste management and land use, air quality
and environmental governance.
In the framework of the research programme
funded by Siemens AG 30 cities of 30 European
countries were studied first and then the research
was extended over 111 cities globally. Global comparison, however, was not completely objective
according to those performing the research due to
either the lack of data or the difference of data.
Table 4.8 shows the top 10 cities in the rank
sequences produced by the three different methods.
It can be seen that the ranks of cities qualified
using the three methods are not similar. The fact,
however, that Copenhagen, Stockholm, Helsinki
and Vienna are in the top ten in all three ranks is
telling. It can be declared that the four city
approaches the most expected level of sustainable development. It is worth noting that
European cities dominate in the top ten in other
lists as well. Regarding the Sustainable Cities
Index (2016) 8 European cities can be found
among the top ten cities.
Apart from the mentioned ones, a number of
rankings exist that qualify cities as healthy and
humane residential environments. Their role is
considered important by the authors of this book
in relation to designing sustainable cities. City
leaders also make efforts to help their cities qualified better in such ranks. It has to be understood,
however, that making cities liveable is not a simple task. Destroying shantytowns is not a solution
for the millions living there. Is it possible to put
them into more humane conditions? Can the city
provide residence and job elsewhere for those living in shantytowns? The structure of the built
environment of a major city is also not easy to
Table 4.8 Rank of major cities according to different
qualification systems (simplified after Csizmadia 2016)
UN-Habitat
Monocle
Siemens
Vienna
Copenhagen
Copenhagen
Helsinki
Tokyo
Stockholm
Oslo
Melbourne
Oslo
Dublin
Stockholm
Vienna
Copenhagen
Helsinki
Amsterdam
Tokyo
Vienna
Zürich
London
Zürich
Helsinki
Melbourne
Munich
Berlin
Stockholm
Kyoto
Brussels
Paris
Fukuoka
Paris
Box 4.4 Parameters and Indicators of
European Green City Index
Parameters
Indicators
Carbon
dioxide
CO 2 intensity
CO 2 emissions
CO 2 reduction strategy
Energy
Energy consumption
Energy intensity
Renewable energy
consumption
Clean and efficient energy
policies
Buildings
Energy consumption of
residential buildings
Energy-efficient buildings
standard
Energy-efficient buildings
initiatives
Transport
Use of non-car transport
Size of non-car transport
network
Green transport promotion
Congestion reduction policies
Waste and
land use
Municipal waste production
Waste recycling
Waste reduction policies
Green land use policies
Water
Water consumption
System leakages
Wastewater system treatment
Water efficiency and treatment
policies
Air quality
Nitrogen dioxide
Sulphur dioxide
Ozone
Particulate matter
Clean air policies
Environmental
governance
Green action plan
Green management
Public participation in green
policy
4 Changes on Earth as a Result of Interaction Between the Society and Nature
Green City Index of Siemens takes environmental sustainability into the focus. The survey
was performed by Economist Intelligence Unit
on behalf of Siemens company. The index was
calculated on the basis of eight parameters (30
indicators within them, see Box 4.4) including
carbon dioxide emission, energy utilisation, state
of buildings, quality of traffic, water quality and
use, waste management and land use, air quality
and environmental governance.
In the framework of the research programme
funded by Siemens AG 30 cities of 30 European
countries were studied first and then the research
was extended over 111 cities globally. Global comparison, however, was not completely objective
according to those performing the research due to
either the lack of data or the difference of data.
Table 4.8 shows the top 10 cities in the rank
sequences produced by the three different methods.
It can be seen that the ranks of cities qualified
using the three methods are not similar. The fact,
however, that Copenhagen, Stockholm, Helsinki
and Vienna are in the top ten in all three ranks is
telling. It can be declared that the four city
approaches the most expected level of sustainable development. It is worth noting that
European cities dominate in the top ten in other
lists as well. Regarding the Sustainable Cities
Index (2016) 8 European cities can be found
among the top ten cities.
Apart from the mentioned ones, a number of
rankings exist that qualify cities as healthy and
humane residential environments. Their role is
considered important by the authors of this book
in relation to designing sustainable cities. City
leaders also make efforts to help their cities qualified better in such ranks. It has to be understood,
however, that making cities liveable is not a simple task. Destroying shantytowns is not a solution
for the millions living there. Is it possible to put
them into more humane conditions? Can the city
provide residence and job elsewhere for those living in shantytowns? The structure of the built
environment of a major city is also not easy to
Table 4.8 Rank of major cities according to different
qualification systems (simplified after Csizmadia 2016)
UN-Habitat
Monocle
Siemens
Vienna
Copenhagen
Copenhagen
Helsinki
Tokyo
Stockholm
Oslo
Melbourne
Oslo
Dublin
Stockholm
Vienna
Copenhagen
Helsinki
Amsterdam
Tokyo
Vienna
Zürich
London
Zürich
Helsinki
Melbourne
Munich
Berlin
Stockholm
Kyoto
Brussels
Paris
Fukuoka
Paris
Box 4.4 Parameters and Indicators of
European Green City Index
Parameters
Indicators
Carbon
dioxide
CO 2 intensity
CO 2 emissions
CO 2 reduction strategy
Energy
Energy consumption
Energy intensity
Renewable energy
consumption
Clean and efficient energy
policies
Buildings
Energy consumption of
residential buildings
Energy-efficient buildings
standard
Energy-efficient buildings
initiatives
Transport
Use of non-car transport
Size of non-car transport
network
Green transport promotion
Congestion reduction policies
Waste and
land use
Municipal waste production
Waste recycling
Waste reduction policies
Green land use policies
Water
Water consumption
System leakages
Wastewater system treatment
Water efficiency and treatment
policies
Air quality
Nitrogen dioxide
Sulphur dioxide
Ozone
Particulate matter
Clean air policies
Environmental
governance
Green action plan
Green management
Public participation in green
policy
4 Changes on Earth as a Result of Interaction Between the Society and Nature