

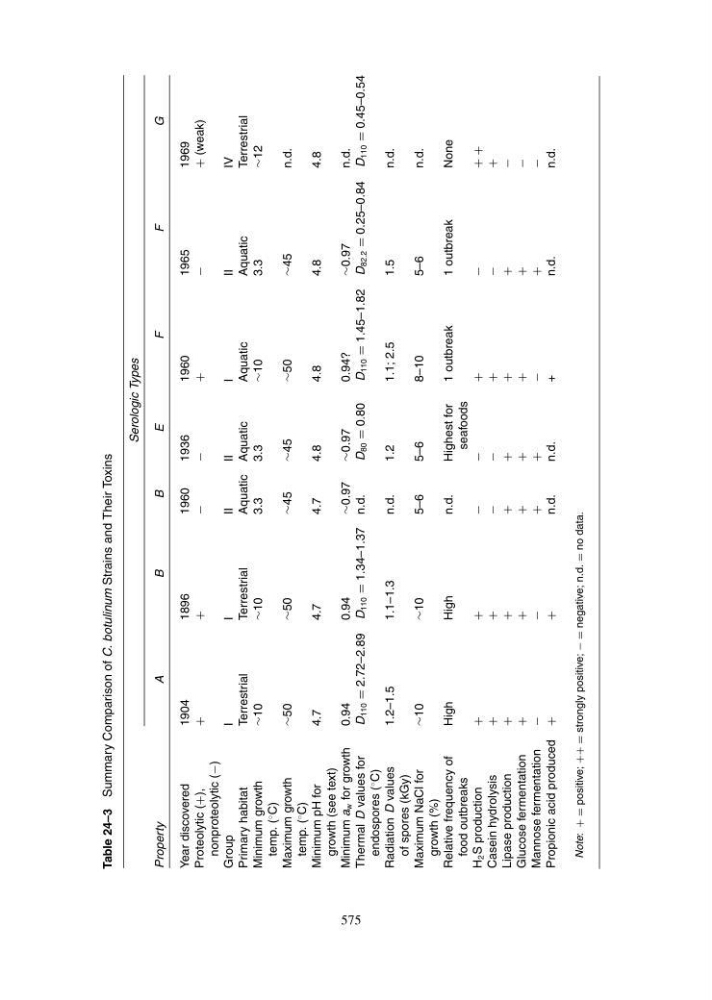
Table 24–3
Summary Comparison of C. botulinum Strains and Their Toxins
Serologic Types
Property
A
B
B
E
F
F
G
Year discovered
1904
1896
1960
1936
1960
1965
1969
Proteolytic (+),
nonproteolytic (−)
+
+
−
−
+
−
+ (weak)
Group
I
I
II
II
I
II
IV
Primary habitat
Terrestrial
Terrestrial
Aquatic Aquatic
Aquatic
Aquatic
Terrestrial
Minimum growth
temp. (
◦
C)
∼10
∼10
3.3
3.3
∼10
3.3
∼12
Maximum growth
temp. (
◦
C)
∼50
∼50
∼45
∼45
∼50
∼45
n.d.
Minimum pH for
growth (see text)
4.7
4.7
4.7
4.8
4.8
4.8
4.8
Minimum a
w for growth
0.94
0.94
∼0.97
∼0.97
0.94?
∼0.97
n.d.
Thermal D values for
endospores (
◦
C)
D
110
= 2.72–2.89 D
110
= 1.34–1.37 n.d.
D
80
= 0.80
D
110
= 1.45–1.82 D
82.2
= 0.25–0.84 D
110
= 0.45–0.54
Radiation D values
of spores (kGy)
1.2–1.5
1.1–1.3
n.d.
1.2
1.1; 2.5
1.5
n.d.
Maximum NaCl for
growth (%)
∼10
∼10
5–6
5–6
8–10
5–6
n.d.
Relative frequency of
food outbreaks
High
High
n.d.
Highest for
seafoods
1 outbreak
1 outbreak
None
H
2 S production
+
+
−
−
+
−
+ +
Casein hydrolysis
+
+
−
−
+
−
+
Lipase production
+
+
+
+
+
+
−
Glucose fermentation
+
+
+
+
+
+
−
Mannose fermentation
−
−
+
+
−
+
−
Propionic acid produced
+
+
n.d.
n.d.
+
n.d.
n.d.
Note:
+ = positive;
++ = strongly positive;
− = negative; n.d.
= no data.
575