

556 Modern Food Microbiology
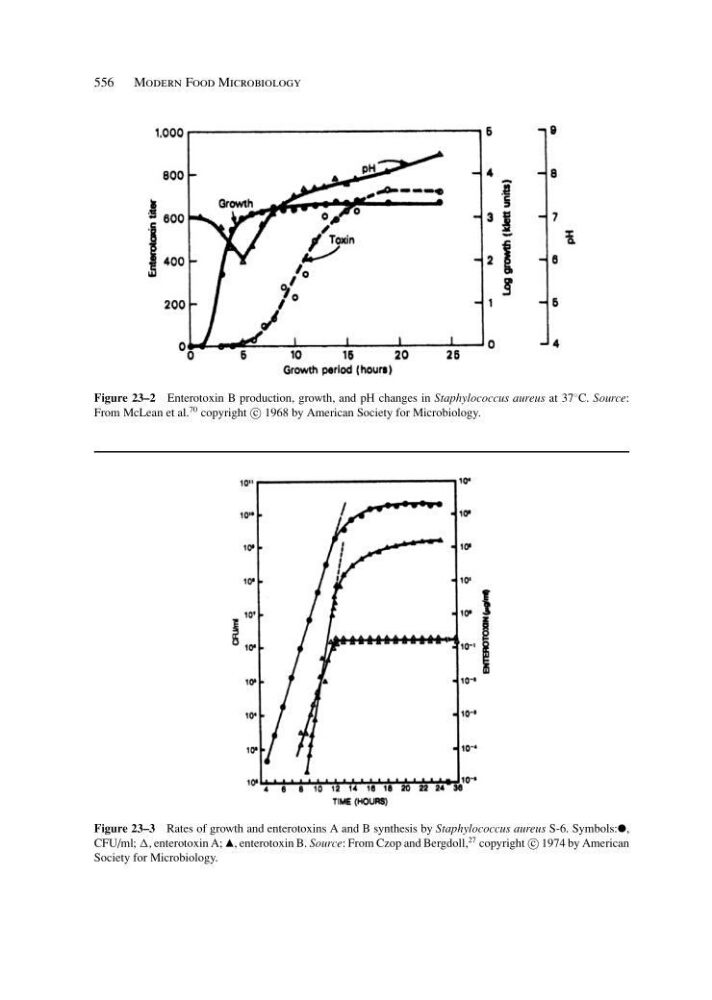
Figure 23–2 Enterotoxin B production, growth, and pH changes in Staphylococcus aureus at 37
◦ C. Source:
From McLean et al.
70 copyright c
1968 by American Society for Microbiology.
Figure 23–3 Rates of growth and enterotoxins A and B synthesis by Staphylococcus aureus S-6. Symbols:᭹,
CFU/ml; , enterotoxin A; ᭡, enterotoxin B. Source: From Czop and Bergdoll,
27 copyright c
1974 by American
Society for Microbiology.