

Vegetable and Fruit Products
137
applied to fruits in a 50:50 ratio at levels up to 2 × 10
7 and 8 × 10
7 cfu/ml and held at room temperature,
no blue mold rot was observed, and gray mold lesion size was reduced by >95%.
Several spoilage conditions of onions are shown in Figure 6–3.
SPOILAGE OF FRUITS
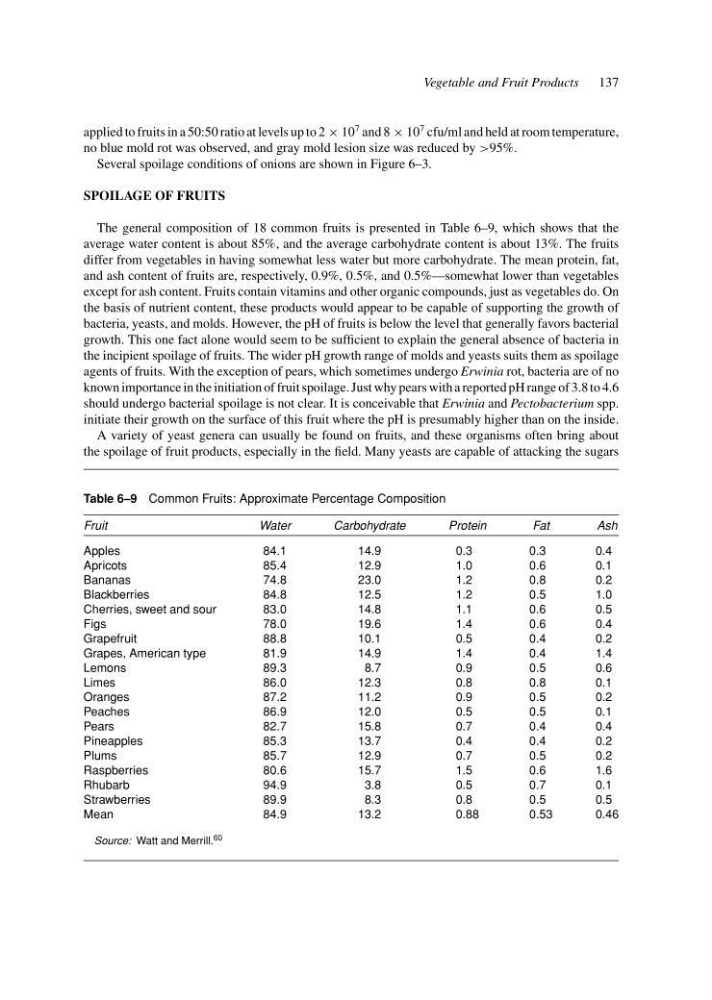
The general composition of 18 common fruits is presented in Table 6–9, which shows that the
average water content is about 85%, and the average carbohydrate content is about 13%. The fruits
differ from vegetables in having somewhat less water but more carbohydrate. The mean protein, fat,
and ash content of fruits are, respectively, 0.9%, 0.5%, and 0.5%—somewhat lower than vegetables
except for ash content. Fruits contain vitamins and other organic compounds, just as vegetables do. On
the basis of nutrient content, these products would appear to be capable of supporting the growth of
bacteria, yeasts, and molds. However, the pH of fruits is below the level that generally favors bacterial
growth. This one fact alone would seem to be sufficient to explain the general absence of bacteria in
the incipient spoilage of fruits. The wider pH growth range of molds and yeasts suits them as spoilage
agents of fruits. With the exception of pears, which sometimes undergo Erwinia rot, bacteria are of no
known importance in the initiation of fruit spoilage. Just why pears with a reported pH range of 3.8 to 4.6
should undergo bacterial spoilage is not clear. It is conceivable that Erwinia and Pectobacterium spp.
initiate their growth on the surface of this fruit where the pH is presumably higher than on the inside.
A variety of yeast genera can usually be found on fruits, and these organisms often bring about
the spoilage of fruit products, especially in the field. Many yeasts are capable of attacking the sugars
Table 6–9 Common Fruits: Approximate Percentage Composition
Fruit
Water
Carbohydrate
Protein
Fat
Ash
Apples
84.1
14.9
0.3
0.3
0.4
Apricots
85.4
12.9
1.0
0.6
0.1
Bananas
74.8
23.0
1.2
0.8
0.2
Blackberries
84.8
12.5
1.2
0.5
1.0
Cherries, sweet and sour
83.0
14.8
1.1
0.6
0.5
Figs
78.0
19.6
1.4
0.6
0.4
Grapefruit
88.8
10.1
0.5
0.4
0.2
Grapes, American type
81.9
14.9
1.4
0.4
1.4
Lemons
89.3
8.7
0.9
0.5
0.6
Limes
86.0
12.3
0.8
0.8
0.1
Oranges
87.2
11.2
0.9
0.5
0.2
Peaches
86.9
12.0
0.5
0.5
0.1
Pears
82.7
15.8
0.7
0.4
0.4
Pineapples
85.3
13.7
0.4
0.4
0.2
Plums
85.7
12.9
0.7
0.5
0.2
Raspberries
80.6
15.7
1.5
0.6
1.6
Rhubarb
94.9
3.8
0.5
0.7
0.1
Strawberries
89.9
8.3
0.8
0.5
0.5
Mean
84.9
13.2
0.88
0.53
0.46
Source: Watt and Merrill. 60
137
applied to fruits in a 50:50 ratio at levels up to 2 × 10
7 and 8 × 10
7 cfu/ml and held at room temperature,
no blue mold rot was observed, and gray mold lesion size was reduced by >95%.
Several spoilage conditions of onions are shown in Figure 6–3.
SPOILAGE OF FRUITS
The general composition of 18 common fruits is presented in Table 6–9, which shows that the
average water content is about 85%, and the average carbohydrate content is about 13%. The fruits
differ from vegetables in having somewhat less water but more carbohydrate. The mean protein, fat,
and ash content of fruits are, respectively, 0.9%, 0.5%, and 0.5%—somewhat lower than vegetables
except for ash content. Fruits contain vitamins and other organic compounds, just as vegetables do. On
the basis of nutrient content, these products would appear to be capable of supporting the growth of
bacteria, yeasts, and molds. However, the pH of fruits is below the level that generally favors bacterial
growth. This one fact alone would seem to be sufficient to explain the general absence of bacteria in
the incipient spoilage of fruits. The wider pH growth range of molds and yeasts suits them as spoilage
agents of fruits. With the exception of pears, which sometimes undergo Erwinia rot, bacteria are of no
known importance in the initiation of fruit spoilage. Just why pears with a reported pH range of 3.8 to 4.6
should undergo bacterial spoilage is not clear. It is conceivable that Erwinia and Pectobacterium spp.
initiate their growth on the surface of this fruit where the pH is presumably higher than on the inside.
A variety of yeast genera can usually be found on fruits, and these organisms often bring about
the spoilage of fruit products, especially in the field. Many yeasts are capable of attacking the sugars
Table 6–9 Common Fruits: Approximate Percentage Composition
Fruit
Water
Carbohydrate
Protein
Fat
Ash
Apples
84.1
14.9
0.3
0.3
0.4
Apricots
85.4
12.9
1.0
0.6
0.1
Bananas
74.8
23.0
1.2
0.8
0.2
Blackberries
84.8
12.5
1.2
0.5
1.0
Cherries, sweet and sour
83.0
14.8
1.1
0.6
0.5
Figs
78.0
19.6
1.4
0.6
0.4
Grapefruit
88.8
10.1
0.5
0.4
0.2
Grapes, American type
81.9
14.9
1.4
0.4
1.4
Lemons
89.3
8.7
0.9
0.5
0.6
Limes
86.0
12.3
0.8
0.8
0.1
Oranges
87.2
11.2
0.9
0.5
0.2
Peaches
86.9
12.0
0.5
0.5
0.1
Pears
82.7
15.8
0.7
0.4
0.4
Pineapples
85.3
13.7
0.4
0.4
0.2
Plums
85.7
12.9
0.7
0.5
0.2
Raspberries
80.6
15.7
1.5
0.6
1.6
Rhubarb
94.9
3.8
0.5
0.7
0.1
Strawberries
89.9
8.3
0.8
0.5
0.5
Mean
84.9
13.2
0.88
0.53
0.46
Source: Watt and Merrill. 60