

Application of Sustainable and Low-Cost Sludge-Based Adsorbents …
67
at a particular temperature, the pH, particle size and liquid phase of the dye concentration. The shape of an isotherm provides information about the affinity of the
dye molecules for adsorption and also reflects the possible mode for adsorbing
dye molecules. Several attempts have been made to find the adsorbed amount of
the dye concentration. The most common method used for obtaining an adsorption
isotherm is by determining the concentration of the dye solution before and after the
adsorption experiments. An adsorption isotherm shows how the adsorbate molecules
partition between the liquid and solid phases when the adsorption process reaches
equilibrium conditions. The analysis of the isotherm data by fitting them to different
isotherm models is an important step to find a suitable model that can be used for the
design of adsorption systems. Two adsorption isotherm models, namely Langmuir
and Freundlich models, have been used in this work. The applicability of the isotherm
models to the adsorption study was compared by judging the maximum adsorption
capacity and the correlation coefficients (R
2 values).
5.3.1 Langmuir Isotherm
The Langmuir isotherm assumes monolayer adsorption onto a surface containing a
finite number of adsorption sites of uniform strategies of adsorption with no transmigration of adsorbate in the plane of surface [66]. The Langmuir equation can be
expressed in mathematical form as
C e /q e = 1/Q o b + C e /Q o
(5.1)
where C e is the equilibrium concentration (mg/L), q e is the amount adsorbed at
equilibrium (mg/g), Q o is the adsorption capacity (mg/g) and b is the energy of
adsorption (Langmuir constant, L/mg). The maximum adsorption capacity (Q o ) and
Langmuir constant (b) were calculated from the slope and intercept of the linear
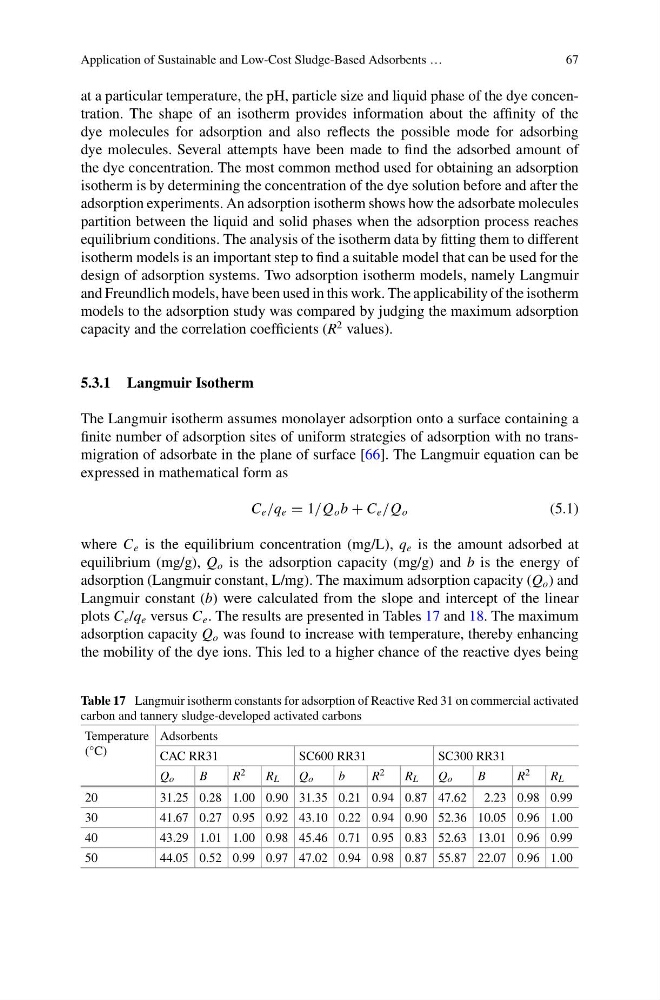
plots C e /q e versus C e . The results are presented in Tables 17 and 18. The maximum
adsorption capacity Q o was found to increase with temperature, thereby enhancing
the mobility of the dye ions. This led to a higher chance of the reactive dyes being
Table 17 Langmuir isotherm constants for adsorption of Reactive Red 31 on commercial activated
carbon and tannery sludge-developed activated carbons
Temperature
(°C)
Adsorbents
CAC RR31
SC600 RR31
SC300 RR31
Q o
B
R 2
R L
Q o
b
R 2
R L
Q o
B
R 2
R L
20
31.25 0.28 1.00 0.90 31.35 0.21 0.94 0.87 47.62 2.23 0.98 0.99
30
41.67 0.27 0.95 0.92 43.10 0.22 0.94 0.90 52.36 10.05 0.96 1.00
40
43.29 1.01 1.00 0.98 45.46 0.71 0.95 0.83 52.63 13.01 0.96 0.99
50
44.05 0.52 0.99 0.97 47.02 0.94 0.98 0.87 55.87 22.07 0.96 1.00
67
at a particular temperature, the pH, particle size and liquid phase of the dye concentration. The shape of an isotherm provides information about the affinity of the
dye molecules for adsorption and also reflects the possible mode for adsorbing
dye molecules. Several attempts have been made to find the adsorbed amount of
the dye concentration. The most common method used for obtaining an adsorption
isotherm is by determining the concentration of the dye solution before and after the
adsorption experiments. An adsorption isotherm shows how the adsorbate molecules
partition between the liquid and solid phases when the adsorption process reaches
equilibrium conditions. The analysis of the isotherm data by fitting them to different
isotherm models is an important step to find a suitable model that can be used for the
design of adsorption systems. Two adsorption isotherm models, namely Langmuir
and Freundlich models, have been used in this work. The applicability of the isotherm
models to the adsorption study was compared by judging the maximum adsorption
capacity and the correlation coefficients (R
2 values).
5.3.1 Langmuir Isotherm
The Langmuir isotherm assumes monolayer adsorption onto a surface containing a
finite number of adsorption sites of uniform strategies of adsorption with no transmigration of adsorbate in the plane of surface [66]. The Langmuir equation can be
expressed in mathematical form as
C e /q e = 1/Q o b + C e /Q o
(5.1)
where C e is the equilibrium concentration (mg/L), q e is the amount adsorbed at
equilibrium (mg/g), Q o is the adsorption capacity (mg/g) and b is the energy of
adsorption (Langmuir constant, L/mg). The maximum adsorption capacity (Q o ) and
Langmuir constant (b) were calculated from the slope and intercept of the linear
plots C e /q e versus C e . The results are presented in Tables 17 and 18. The maximum
adsorption capacity Q o was found to increase with temperature, thereby enhancing
the mobility of the dye ions. This led to a higher chance of the reactive dyes being
Table 17 Langmuir isotherm constants for adsorption of Reactive Red 31 on commercial activated
carbon and tannery sludge-developed activated carbons
Temperature
(°C)
Adsorbents
CAC RR31
SC600 RR31
SC300 RR31
Q o
B
R 2
R L
Q o
b
R 2
R L
Q o
B
R 2
R L
20
31.25 0.28 1.00 0.90 31.35 0.21 0.94 0.87 47.62 2.23 0.98 0.99
30
41.67 0.27 0.95 0.92 43.10 0.22 0.94 0.90 52.36 10.05 0.96 1.00
40
43.29 1.01 1.00 0.98 45.46 0.71 0.95 0.83 52.63 13.01 0.96 0.99
50
44.05 0.52 0.99 0.97 47.02 0.94 0.98 0.87 55.87 22.07 0.96 1.00