

7.1.2 Alcohol Ethoxylate (AE)
The addition concentration of alcohol ethoxylate (AE) was adjusted to 2, 10, 25, 50,
and 100 mg/L and added on the 16th day of the stable state into the microcosm. The
endpoints were abundance (structural parameter) and the DO concentration (functional parameter), and the population was measured using an optical microscope and
counted the start of culturing on days 0, 2, 4, 7, 14, 16, 18, 20, 23, and 30, and it was
evaluated from the results of B 16–30 (days 16–30), which was the ratio of the
abundance and the population density (N 30 ) on the 30th day. The concentration of
DO was measured continuously from the 16th day onward, and the P/R ratio was
calculated from the amount of production (P) and respiration (R). Using the structural parameter, a constant population was maintained for all microorganisms in the
control system through the experimental period, and a constant population was
likewise maintained at a 2 mg/L AE load. A decrease in microanimals was confirmed
in both the 10 mg/L and 25 mg/L AE load systems until the 2nd and 4th days,
respectively, but their populations had recovered to nearly the same as that in the
0 1
2
3
4
5 6
7
8 9
10 11 12
13
14
0 1
2
34 5
6 7 8 9
10 11
12
13
14
0
1
2 3 4 5
6 7 8
9
10
11 12
13
14
0
1 2
3
4
5 6
7 8 9
10
11 12 13
14
Production O2 mg
200mL -1
Respiration O2 mg 200mL -1
LAS 5mg/L
LAS 1mg/L
LAS 10mg/L
control
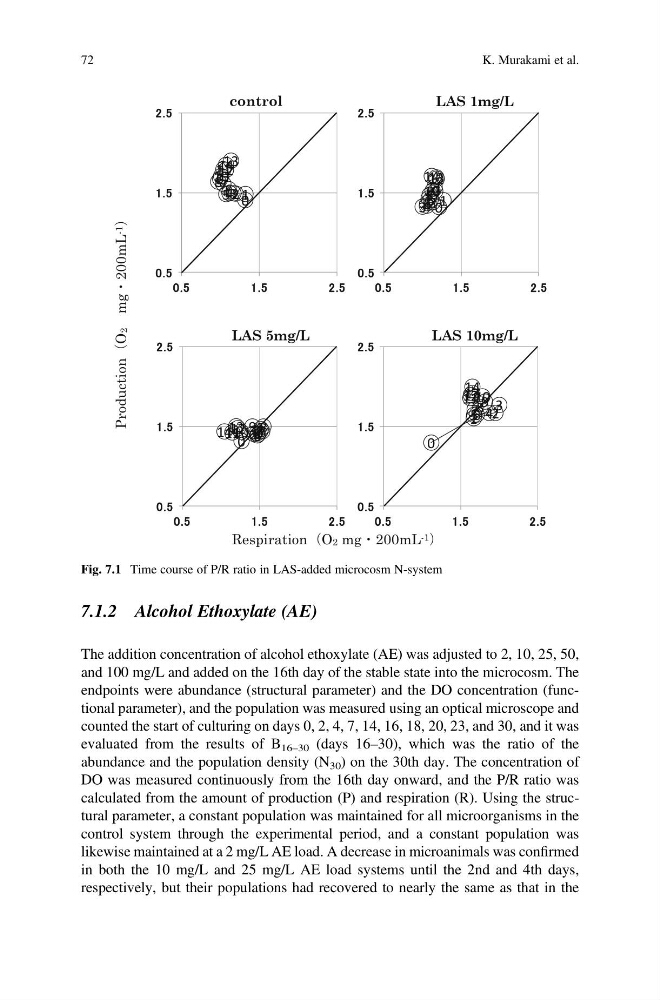
Fig. 7.1 Time course of P/R ratio in LAS-added microcosm N-system
72
K. Murakami et al.
The addition concentration of alcohol ethoxylate (AE) was adjusted to 2, 10, 25, 50,
and 100 mg/L and added on the 16th day of the stable state into the microcosm. The
endpoints were abundance (structural parameter) and the DO concentration (functional parameter), and the population was measured using an optical microscope and
counted the start of culturing on days 0, 2, 4, 7, 14, 16, 18, 20, 23, and 30, and it was
evaluated from the results of B 16–30 (days 16–30), which was the ratio of the
abundance and the population density (N 30 ) on the 30th day. The concentration of
DO was measured continuously from the 16th day onward, and the P/R ratio was
calculated from the amount of production (P) and respiration (R). Using the structural parameter, a constant population was maintained for all microorganisms in the
control system through the experimental period, and a constant population was
likewise maintained at a 2 mg/L AE load. A decrease in microanimals was confirmed
in both the 10 mg/L and 25 mg/L AE load systems until the 2nd and 4th days,
respectively, but their populations had recovered to nearly the same as that in the
0 1
2
3
4
5 6
7
8 9
10 11 12
13
14
0 1
2
34 5
6 7 8 9
10 11
12
13
14
0
1
2 3 4 5
6 7 8
9
10
11 12
13
14
0
1 2
3
4
5 6
7 8 9
10
11 12 13
14
Production O2 mg
200mL -1
Respiration O2 mg 200mL -1
LAS 5mg/L
LAS 1mg/L
LAS 10mg/L
control
Fig. 7.1 Time course of P/R ratio in LAS-added microcosm N-system
72
K. Murakami et al.