

difference at the point of group X, there was an influence, even if the numerical mean
was the same all day.
6.3.2 Calculation Example
The nonylphenol addition test of the microcosm provides numerical values, such as
those shown in Table 4.3, and the results of the branching-type ANOVA are
presented in this chapter. An example of the calculations used to analyze the
influence of nonylphenol, which uses the P and R in the microcosm, is also shown
below. The experimental conditions in a normal microcosm test (refer to Sect. 3.1)
are shown in Table 6.3.
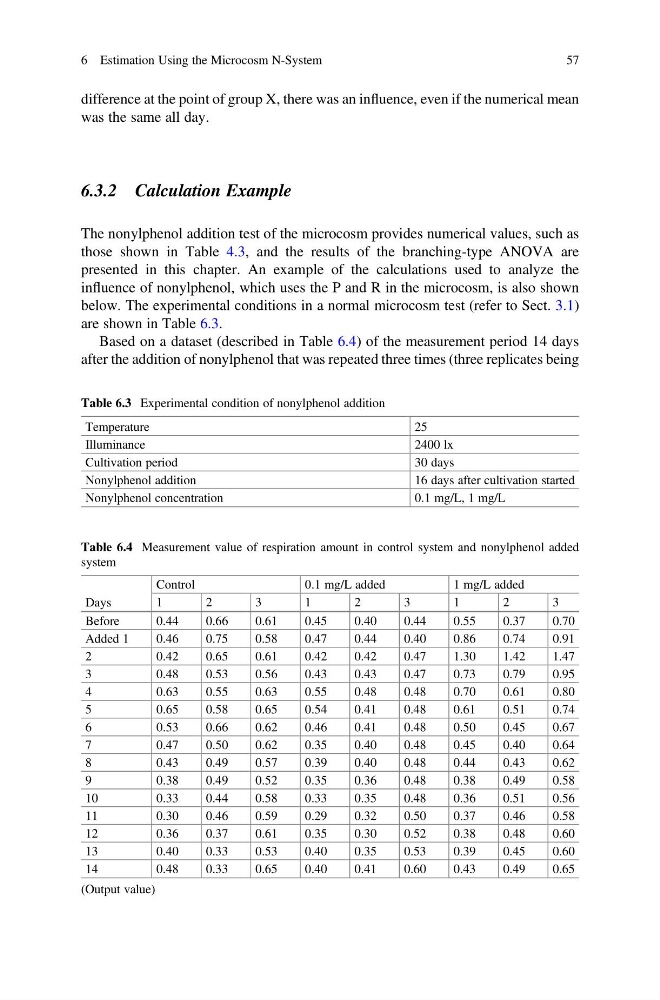
Based on a dataset (described in Table 6.4) of the measurement period 14 days
after the addition of nonylphenol that was repeated three times (three replicates being
Table 6.3 Experimental condition of nonylphenol addition
Temperature
25
Illuminance
2400 lx
Cultivation period
30 days
Nonylphenol addition
16 days after cultivation started
Nonylphenol concentration
0.1 mg/L, 1 mg/L
Table 6.4 Measurement value of respiration amount in control system and nonylphenol added
system
Days
Control
0.1 mg/L added
1 mg/L added
1
2
3
1
2
3
1
2
3
Before
0.44
0.66
0.61
0.45
0.40
0.44
0.55
0.37
0.70
Added 1
0.46
0.75
0.58
0.47
0.44
0.40
0.86
0.74
0.91
2
0.42
0.65
0.61
0.42
0.42
0.47
1.30
1.42
1.47
3
0.48
0.53
0.56
0.43
0.43
0.47
0.73
0.79
0.95
4
0.63
0.55
0.63
0.55
0.48
0.48
0.70
0.61
0.80
5
0.65
0.58
0.65
0.54
0.41
0.48
0.61
0.51
0.74
6
0.53
0.66
0.62
0.46
0.41
0.48
0.50
0.45
0.67
7
0.47
0.50
0.62
0.35
0.40
0.48
0.45
0.40
0.64
8
0.43
0.49
0.57
0.39
0.40
0.48
0.44
0.43
0.62
9
0.38
0.49
0.52
0.35
0.36
0.48
0.38
0.49
0.58
10
0.33
0.44
0.58
0.33
0.35
0.48
0.36
0.51
0.56
11
0.30
0.46
0.59
0.29
0.32
0.50
0.37
0.46
0.58
12
0.36
0.37
0.61
0.35
0.30
0.52
0.38
0.48
0.60
13
0.40
0.33
0.53
0.40
0.35
0.53
0.39
0.45
0.60
14
0.48
0.33
0.65
0.40
0.41
0.60
0.43
0.49
0.65
(Output value)
6 Estimation Using the Microcosm N-System
57
was the same all day.
6.3.2 Calculation Example
The nonylphenol addition test of the microcosm provides numerical values, such as
those shown in Table 4.3, and the results of the branching-type ANOVA are
presented in this chapter. An example of the calculations used to analyze the
influence of nonylphenol, which uses the P and R in the microcosm, is also shown
below. The experimental conditions in a normal microcosm test (refer to Sect. 3.1)
are shown in Table 6.3.
Based on a dataset (described in Table 6.4) of the measurement period 14 days
after the addition of nonylphenol that was repeated three times (three replicates being
Table 6.3 Experimental condition of nonylphenol addition
Temperature
25
Illuminance
2400 lx
Cultivation period
30 days
Nonylphenol addition
16 days after cultivation started
Nonylphenol concentration
0.1 mg/L, 1 mg/L
Table 6.4 Measurement value of respiration amount in control system and nonylphenol added
system
Days
Control
0.1 mg/L added
1 mg/L added
1
2
3
1
2
3
1
2
3
Before
0.44
0.66
0.61
0.45
0.40
0.44
0.55
0.37
0.70
Added 1
0.46
0.75
0.58
0.47
0.44
0.40
0.86
0.74
0.91
2
0.42
0.65
0.61
0.42
0.42
0.47
1.30
1.42
1.47
3
0.48
0.53
0.56
0.43
0.43
0.47
0.73
0.79
0.95
4
0.63
0.55
0.63
0.55
0.48
0.48
0.70
0.61
0.80
5
0.65
0.58
0.65
0.54
0.41
0.48
0.61
0.51
0.74
6
0.53
0.66
0.62
0.46
0.41
0.48
0.50
0.45
0.67
7
0.47
0.50
0.62
0.35
0.40
0.48
0.45
0.40
0.64
8
0.43
0.49
0.57
0.39
0.40
0.48
0.44
0.43
0.62
9
0.38
0.49
0.52
0.35
0.36
0.48
0.38
0.49
0.58
10
0.33
0.44
0.58
0.33
0.35
0.48
0.36
0.51
0.56
11
0.30
0.46
0.59
0.29
0.32
0.50
0.37
0.46
0.58
12
0.36
0.37
0.61
0.35
0.30
0.52
0.38
0.48
0.60
13
0.40
0.33
0.53
0.40
0.35
0.53
0.39
0.45
0.60
14
0.48
0.33
0.65
0.40
0.41
0.60
0.43
0.49
0.65
(Output value)
6 Estimation Using the Microcosm N-System
57