

Simplified Statistical Process
All microcosms, including the control system, are treated as equivalent, and, for the
microcosm (N-system), it is assumed that the difference between the flask (Æ1σ both
in structure and function) can be ignored due to its stability and reproducibility,
which has extended for more than 40 years. The microcosm was cultured in triplicate
for each experimental condition, and the obtained data were evaluated using a
Student’s t-test for significance. The coefficients of variation (i.e., the standard
deviation and mean, expressed as percentages) for the production rate and the
respiration rate in the microcosm from the beginning of the culture to the 7th day
were 20% or less (N ¼ 25 independent experiments), and those from the 14th day to
the 21st day were 5% or less. These values are nearly identical to previously reported
values.
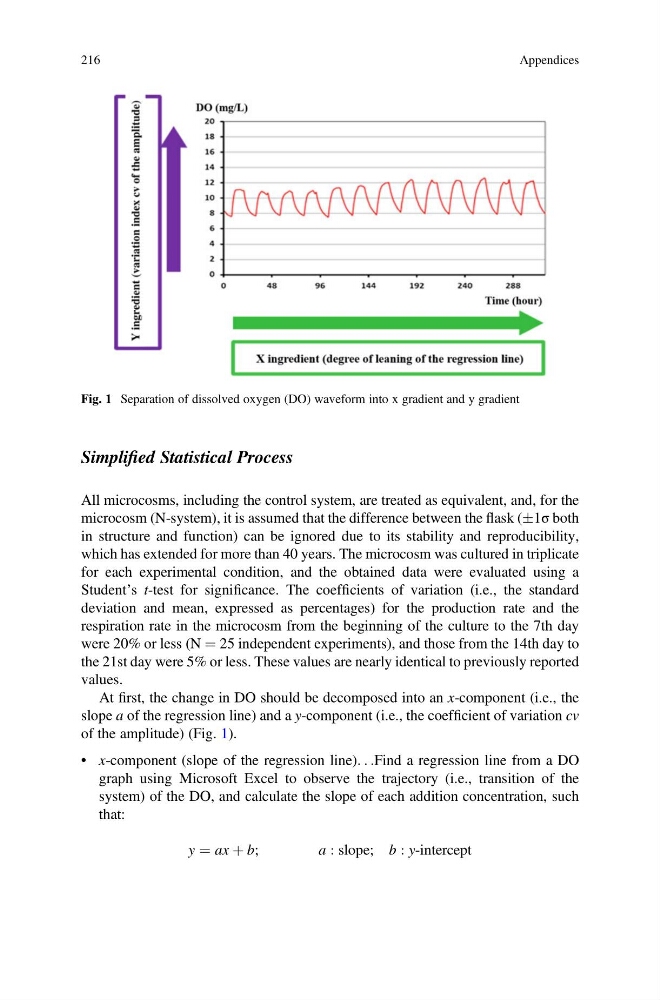
At first, the change in DO should be decomposed into an x-component (i.e., the
slope a of the regression line) and a y-component (i.e., the coefficient of variation cv
of the amplitude) (Fig. 1).
• x-component (slope of the regression line). . .Find a regression line from a DO
graph using Microsoft Excel to observe the trajectory (i.e., transition of the
system) of the DO, and calculate the slope of each addition concentration, such
that:
y ¼ ax þ b;
a : slope; b : y-intercept
Fig. 1 Separation of dissolved oxygen (DO) waveform into x gradient and y gradient
216
Appendices
All microcosms, including the control system, are treated as equivalent, and, for the
microcosm (N-system), it is assumed that the difference between the flask (Æ1σ both
in structure and function) can be ignored due to its stability and reproducibility,
which has extended for more than 40 years. The microcosm was cultured in triplicate
for each experimental condition, and the obtained data were evaluated using a
Student’s t-test for significance. The coefficients of variation (i.e., the standard
deviation and mean, expressed as percentages) for the production rate and the
respiration rate in the microcosm from the beginning of the culture to the 7th day
were 20% or less (N ¼ 25 independent experiments), and those from the 14th day to
the 21st day were 5% or less. These values are nearly identical to previously reported
values.
At first, the change in DO should be decomposed into an x-component (i.e., the
slope a of the regression line) and a y-component (i.e., the coefficient of variation cv
of the amplitude) (Fig. 1).
• x-component (slope of the regression line). . .Find a regression line from a DO
graph using Microsoft Excel to observe the trajectory (i.e., transition of the
system) of the DO, and calculate the slope of each addition concentration, such
that:
y ¼ ax þ b;
a : slope; b : y-intercept
Fig. 1 Separation of dissolved oxygen (DO) waveform into x gradient and y gradient
216
Appendices