

between the NOEC in the flask-scale microcosm and the large-scale ecosystem
model, with larger aquatic animals and plants, suggests that it is possible to predict
the difference in the influence of the concentration across different ecosystem scales
and species compositions by collecting basic data. Furthermore, in the large-scale
ecosystem model, it is possible to evaluate not only the fish (predators) but also the
influence of aquatic plants (producers) on ecosystem functions. It is a great advantage that the survivorship/mortality of the aquatic animal populations can be quickly
determined from the changes in the DO value or the P/R ratio. By collecting such
basic data, it is possible to ensure the accuracy of the correlation between these
model ecosystems and natural ecosystems. As a result, it is expected that the NOEC
of chemical substances can be accurately predicted for natural ecosystems using
large-scale models of aquatic ecosystem. It is also expected to be useful as a tool for
managing chemical substances, including surfactants.
Based on the results of experiments with the addition of LAS and AE, the
ecosystem function parameters (DO and P/R ratio) in the scaled-up model ecosystem
were consistent with the microcosm N-system. Therefore, the microcosm N-system
adequately reflects the natural ecosystem, and it was shown that it is extremely useful
as a model of ecosystem functions. In the OECD test method, one representative
species from each trophic level of the ecosystem was selected (e.g., Selenastrum
capricornutum (producer), Ceriodaphnia dubia (primary consumer), Danio rerio
(high-order consumer), bacterial luminescence inhibition test (decomposer), etc.) to
evaluate toxicity. The ecosystem effect is then calculated based on the toxicity data
for the most sensitive species. In natural ecosystems, biological interactions, material
circulation, and energy flows exist and differ greatly from the physiological activities
control
Respiration(mg O 2 /L day)
Production(mg O
2 /L day)
50
40
30
20
10
0
0 10 20 30 40 50
1mg/L
Respiration(mg O 2 /L day)
Production(mg O
2 /L day)
0 10 20 30 40 50
50
40
30
20
10
0
0
2mg/L
Respiration(mg O 2 /L day)
Production(mg O
2 /L day)
10 20 30 40 50
50
40
30
20
10
10mg/L
Respiration(mg O 2 /L day)
Production(mg O
2 /L day)
50
40
30
20
10
0 0 10 20 30 40 50
5mg/L
Respiration(mg O 2 /L day)
Production(mg O
2 /L day)
50
40
30
20
10
0
0 10 20 30 40 50
3mg/L
Respiration(mg O 2 /L day)
Production(mg O
2 /L day)
0 10 20 30 40 50
50
40
30
20
10
0
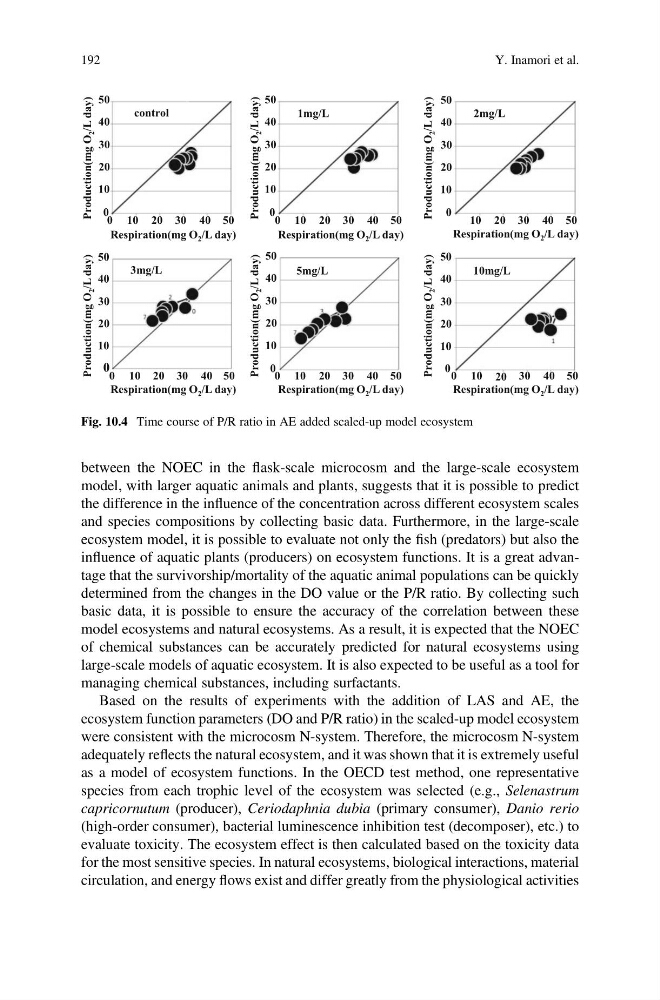
Fig. 10.4 Time course of P/R ratio in AE added scaled-up model ecosystem
192
Y. Inamori et al.
model, with larger aquatic animals and plants, suggests that it is possible to predict
the difference in the influence of the concentration across different ecosystem scales
and species compositions by collecting basic data. Furthermore, in the large-scale
ecosystem model, it is possible to evaluate not only the fish (predators) but also the
influence of aquatic plants (producers) on ecosystem functions. It is a great advantage that the survivorship/mortality of the aquatic animal populations can be quickly
determined from the changes in the DO value or the P/R ratio. By collecting such
basic data, it is possible to ensure the accuracy of the correlation between these
model ecosystems and natural ecosystems. As a result, it is expected that the NOEC
of chemical substances can be accurately predicted for natural ecosystems using
large-scale models of aquatic ecosystem. It is also expected to be useful as a tool for
managing chemical substances, including surfactants.
Based on the results of experiments with the addition of LAS and AE, the
ecosystem function parameters (DO and P/R ratio) in the scaled-up model ecosystem
were consistent with the microcosm N-system. Therefore, the microcosm N-system
adequately reflects the natural ecosystem, and it was shown that it is extremely useful
as a model of ecosystem functions. In the OECD test method, one representative
species from each trophic level of the ecosystem was selected (e.g., Selenastrum
capricornutum (producer), Ceriodaphnia dubia (primary consumer), Danio rerio
(high-order consumer), bacterial luminescence inhibition test (decomposer), etc.) to
evaluate toxicity. The ecosystem effect is then calculated based on the toxicity data
for the most sensitive species. In natural ecosystems, biological interactions, material
circulation, and energy flows exist and differ greatly from the physiological activities
control
Respiration(mg O 2 /L day)
Production(mg O
2 /L day)
50
40
30
20
10
0
0 10 20 30 40 50
1mg/L
Respiration(mg O 2 /L day)
Production(mg O
2 /L day)
0 10 20 30 40 50
50
40
30
20
10
0
0
2mg/L
Respiration(mg O 2 /L day)
Production(mg O
2 /L day)
10 20 30 40 50
50
40
30
20
10
10mg/L
Respiration(mg O 2 /L day)
Production(mg O
2 /L day)
50
40
30
20
10
0 0 10 20 30 40 50
5mg/L
Respiration(mg O 2 /L day)
Production(mg O
2 /L day)
50
40
30
20
10
0
0 10 20 30 40 50
3mg/L
Respiration(mg O 2 /L day)
Production(mg O
2 /L day)
0 10 20 30 40 50
50
40
30
20
10
0
Fig. 10.4 Time course of P/R ratio in AE added scaled-up model ecosystem
192
Y. Inamori et al.