

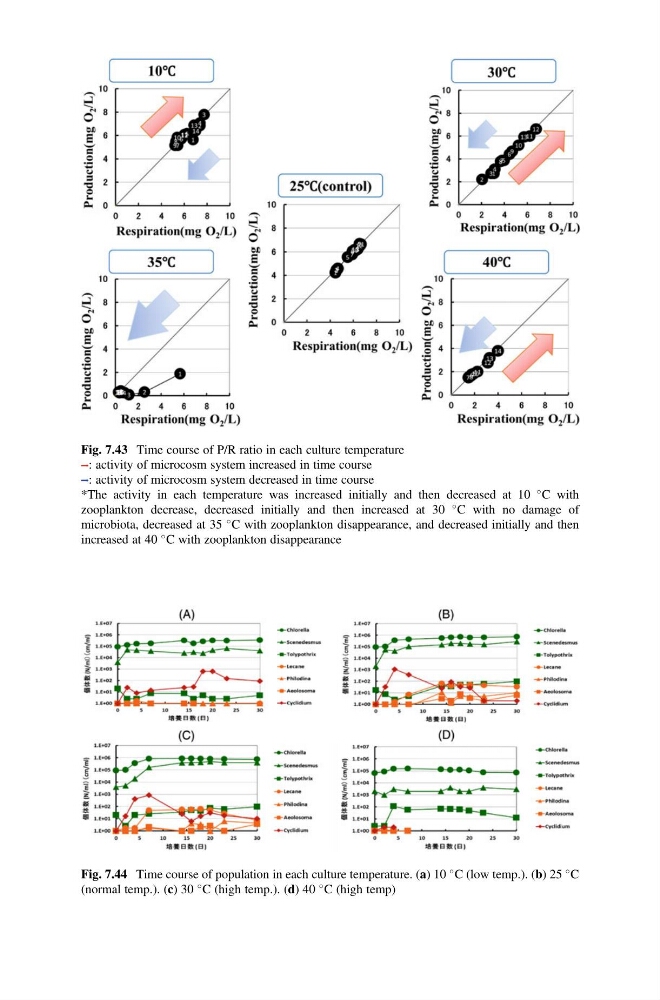
Fig. 7.44 Time course of population in each culture temperature. (a) 10
C (low temp.). (b) 25
C
(normal temp.). (c) 30
C (high temp.). (d) 40
C (high temp)
Fig. 7.43 Time course of P/R ratio in each culture temperature
: activity of microcosm system increased in time course
: activity of microcosm system decreased in time course
*The activity in each temperature was increased initially and then decreased at 10
C with
zooplankton decrease, decreased initially and then increased at 30
C with no damage of
microbiota, decreased at 35
C with zooplankton disappearance, and decreased initially and then
increased at 40
C with zooplankton disappearance
C (low temp.). (b) 25
C
(normal temp.). (c) 30
C (high temp.). (d) 40
C (high temp)
Fig. 7.43 Time course of P/R ratio in each culture temperature
: activity of microcosm system increased in time course
: activity of microcosm system decreased in time course
*The activity in each temperature was increased initially and then decreased at 10
C with
zooplankton decrease, decreased initially and then increased at 30
C with no damage of
microbiota, decreased at 35
C with zooplankton disappearance, and decreased initially and then
increased at 40
C with zooplankton disappearance