

7.10.3 Al
The concentrations of Al were 0.3, 0.6, 1.25, and 5.0 mg/L at the start of microcosm
cultivation (day 0), and Al
3+ was added by adjusting the concentration of AlCl 3 . The
initial concentration of Al
3+ addition except 0.5–1.0 mg/L of systems; with respect to
the population’s metabolic rate, a change was observed over time that differed from
the behavior of the control system. In particular, the concentration of Al
3+ passed at
5 mg/L, and the state of the time change was different, and the extinction of organisms
in the system was observed. The P/R ratio was 1 when 0.6 mg/L of Al was added, and
it became completely over-respirated with the addition of 1.25 mg/L of Al, and the
system collapsed (Fig. 7.25). The m-NOEC of Al was estimated to be 0.3 mg/L. These
macrocosm tests were conducted by Dr. Sugiura (Sugiura 2001, 2009).
7.10.4 Cd
The effect of cadmium was investigated and reported by Dr. Sugiura. Cadmium was
added at the time when microcosm cultivation began (day 0), and the populations of
microorganisms and amounts of respiration and production were tracked over time.
With the addition of Cd, the amounts of respiration and production became larger
than in the control system. The m-NOEC of Cd was estimated to be 0.5 mg/L
(Sugiura 2009).
Z n 2+
control
2.4 mg/L
19.2 mg/L
153.3 mg/L
Production (mgO
2 /day)
Respiration (mgO 2 /day)
1
2
3
1
2
3
1
2
3
1
2
3
1
2
3
1
2
3
1
2
3
1
2
3
Toxicant added
(t=0)
POTENTIAL
VARIABLE
Toxicant
added
(t>0)
Possibility of
transition with
system collapse
Image of
transition
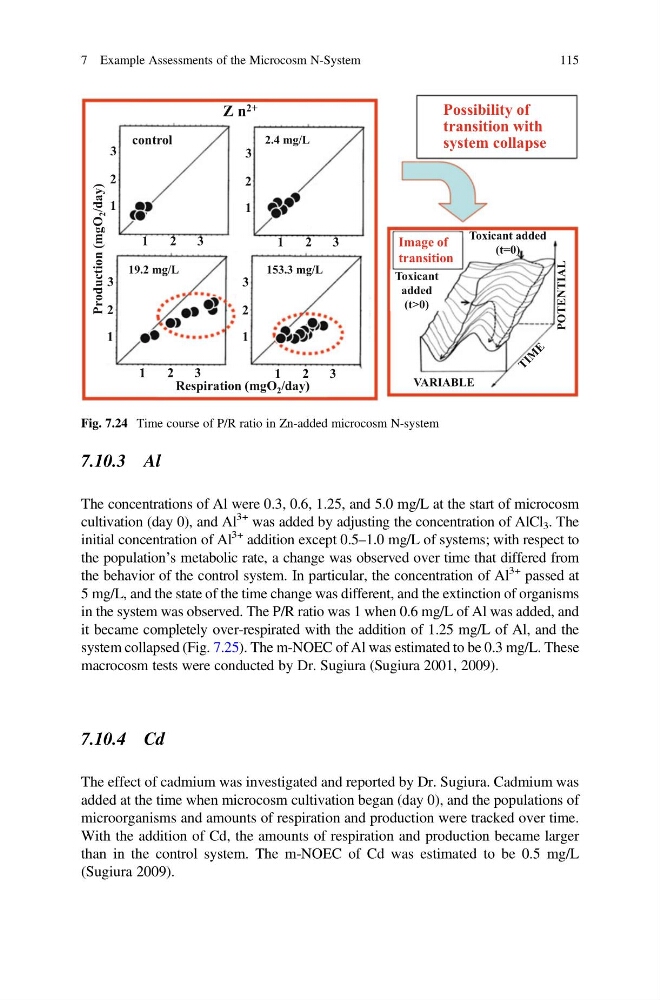
Fig. 7.24 Time course of P/R ratio in Zn-added microcosm N-system
7 Example Assessments of the Microcosm N-System
115
The concentrations of Al were 0.3, 0.6, 1.25, and 5.0 mg/L at the start of microcosm
cultivation (day 0), and Al
3+ was added by adjusting the concentration of AlCl 3 . The
initial concentration of Al
3+ addition except 0.5–1.0 mg/L of systems; with respect to
the population’s metabolic rate, a change was observed over time that differed from
the behavior of the control system. In particular, the concentration of Al
3+ passed at
5 mg/L, and the state of the time change was different, and the extinction of organisms
in the system was observed. The P/R ratio was 1 when 0.6 mg/L of Al was added, and
it became completely over-respirated with the addition of 1.25 mg/L of Al, and the
system collapsed (Fig. 7.25). The m-NOEC of Al was estimated to be 0.3 mg/L. These
macrocosm tests were conducted by Dr. Sugiura (Sugiura 2001, 2009).
7.10.4 Cd
The effect of cadmium was investigated and reported by Dr. Sugiura. Cadmium was
added at the time when microcosm cultivation began (day 0), and the populations of
microorganisms and amounts of respiration and production were tracked over time.
With the addition of Cd, the amounts of respiration and production became larger
than in the control system. The m-NOEC of Cd was estimated to be 0.5 mg/L
(Sugiura 2009).
Z n 2+
control
2.4 mg/L
19.2 mg/L
153.3 mg/L
Production (mgO
2 /day)
Respiration (mgO 2 /day)
1
2
3
1
2
3
1
2
3
1
2
3
1
2
3
1
2
3
1
2
3
1
2
3
Toxicant added
(t=0)
POTENTIAL
VARIABLE
Toxicant
added
(t>0)
Possibility of
transition with
system collapse
Image of
transition
Fig. 7.24 Time course of P/R ratio in Zn-added microcosm N-system
7 Example Assessments of the Microcosm N-System
115