

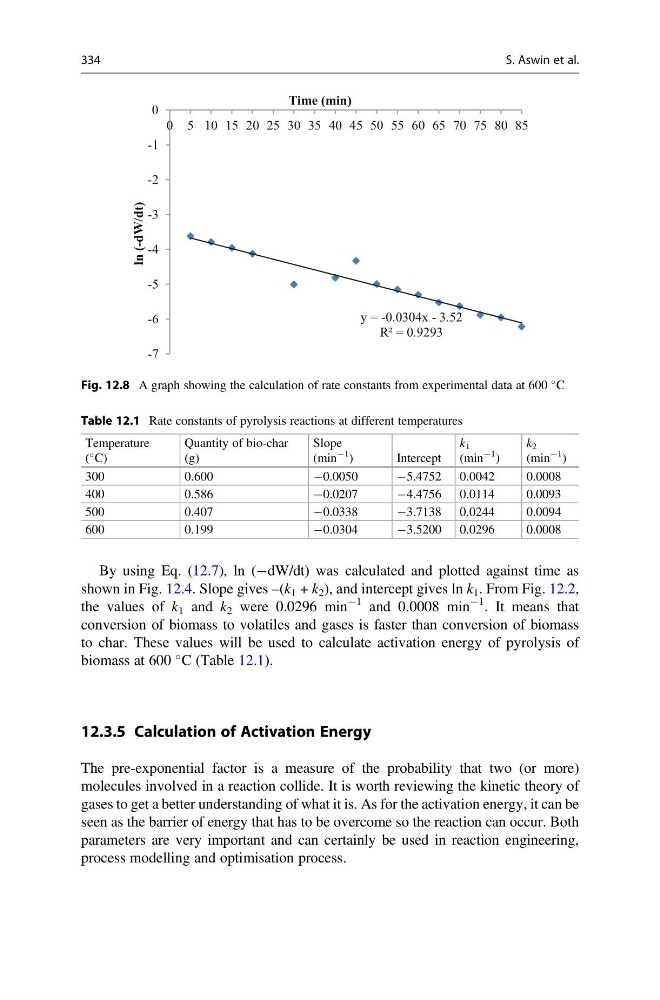
By using Eq. (12.7), ln (ÀdW/dt) was calculated and plotted against time as
shown in Fig. 12.4. Slope gives –(k 1 + k 2 ), and intercept gives ln k 1 . From Fig. 12.2,
the values of k 1 and k 2 were 0.0296 min
À1 and 0.0008 min
À1 . It means that
conversion of biomass to volatiles and gases is faster than conversion of biomass
to char. These values will be used to calculate activation energy of pyrolysis of
biomass at 600
C (Table 12.1).
12.3.5 Calculation of Activation Energy
The pre-exponential factor is a measure of the probability that two (or more)
molecules involved in a reaction collide. It is worth reviewing the kinetic theory of
gases to get a better understanding of what it is. As for the activation energy, it can be
seen as the barrier of energy that has to be overcome so the reaction can occur. Both
parameters are very important and can certainly be used in reaction engineering,
process modelling and optimisation process.
y = -0.0304x - 3.52
R² = 0.9293
-7
-6
-5
-4
-3
-2
-1
0
0 5 10 15 20 25 30 35 40 45 50 55 60 65 70 75 80 85
ln (-dW/dt)
Time (min)
Fig. 12.8 A graph showing the calculation of rate constants from experimental data at 600
C
Table 12.1 Rate constants of pyrolysis reactions at different temperatures
Temperature
(
C)
Quantity of bio-char
(g)
Slope
(min
À1
)
Intercept
k 1
(min
À1
)
k 2
(min
À1
)
300
0.600
À0.0050
À5.4752 0.0042
0.0008
400
0.586
À0.0207
À4.4756 0.0114
0.0093
500
0.407
À0.0338
À3.7138 0.0244
0.0094
600
0.199
À0.0304
À3.5200 0.0296
0.0008
334
S. Aswin et al.
shown in Fig. 12.4. Slope gives –(k 1 + k 2 ), and intercept gives ln k 1 . From Fig. 12.2,
the values of k 1 and k 2 were 0.0296 min
À1 and 0.0008 min
À1 . It means that
conversion of biomass to volatiles and gases is faster than conversion of biomass
to char. These values will be used to calculate activation energy of pyrolysis of
biomass at 600
C (Table 12.1).
12.3.5 Calculation of Activation Energy
The pre-exponential factor is a measure of the probability that two (or more)
molecules involved in a reaction collide. It is worth reviewing the kinetic theory of
gases to get a better understanding of what it is. As for the activation energy, it can be
seen as the barrier of energy that has to be overcome so the reaction can occur. Both
parameters are very important and can certainly be used in reaction engineering,
process modelling and optimisation process.
y = -0.0304x - 3.52
R² = 0.9293
-7
-6
-5
-4
-3
-2
-1
0
0 5 10 15 20 25 30 35 40 45 50 55 60 65 70 75 80 85
ln (-dW/dt)
Time (min)
Fig. 12.8 A graph showing the calculation of rate constants from experimental data at 600
C
Table 12.1 Rate constants of pyrolysis reactions at different temperatures
Temperature
(
C)
Quantity of bio-char
(g)
Slope
(min
À1
)
Intercept
k 1
(min
À1
)
k 2
(min
À1
)
300
0.600
À0.0050
À5.4752 0.0042
0.0008
400
0.586
À0.0207
À4.4756 0.0114
0.0093
500
0.407
À0.0338
À3.7138 0.0244
0.0094
600
0.199
À0.0304
À3.5200 0.0296
0.0008
334
S. Aswin et al.