

742
I. N. Carlotto and M. A. P. Dinis
3 Findings
The general profile of the sample points to the following data: 14% of the professors
(n = 199) were admitted to HEIs surveyed in the early 2000s, 87% of which (n
= 1219) were linked to private HEIs. Of the sample population, 76% (n = 1070)
were female, and 53.7% (n = 752) were between the ages of 46 and 55. When asked
about their fields of expertise, 67% of respondents (n = 943) reported health sciences,
followed by engineering at 10% (n = 142) and humanities at 7% (n = 109). The level
of schooling varied only slightly: 75% (n = 1046) had doctoral degrees while 19%
(n = 266) had master’s degrees. In addition, 60.3% (n = 845) had 15 to 20 years of
teaching experience, and the weekly workload was 40 h for 26.2% of respondents (n
= 368), 20 h for 16.1% of respondents (n = 226), and 30 h for 13.5% of respondents
(n = 189). Of the 1400 professors surveyed, 79.5% have a working relationship with
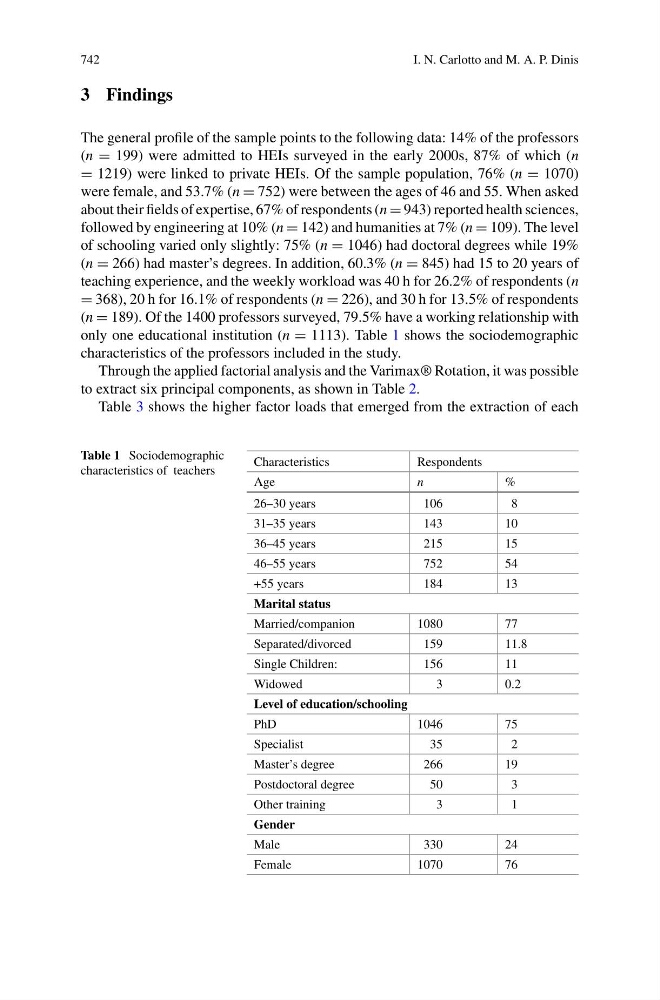
only one educational institution (n = 1113). Table 1 shows the sociodemographic
characteristics of the professors included in the study.
Through the applied factorial analysis and the Varimax® Rotation, it was possible
to extract six principal components, as shown in Table 2.
Table 3 shows the higher factor loads that emerged from the extraction of each
Table 1 Sociodemographic
characteristics of teachers
Characteristics
Respondents
Age
n
%
26–30 years
106
8
31–35 years
143
10
36–45 years
215
15
46–55 years
752
54
+55 years
184
13
Marital status
Married/companion
1080
77
Separated/divorced
159
11.8
Single Children:
156
11
Widowed
3
0.2
Level of education/schooling
PhD
1046
75
Specialist
35
2
Master’s degree
266
19
Postdoctoral degree
50
3
Other training
3
1
Gender
Male
330
24
Female
1070
76
I. N. Carlotto and M. A. P. Dinis
3 Findings
The general profile of the sample points to the following data: 14% of the professors
(n = 199) were admitted to HEIs surveyed in the early 2000s, 87% of which (n
= 1219) were linked to private HEIs. Of the sample population, 76% (n = 1070)
were female, and 53.7% (n = 752) were between the ages of 46 and 55. When asked
about their fields of expertise, 67% of respondents (n = 943) reported health sciences,
followed by engineering at 10% (n = 142) and humanities at 7% (n = 109). The level
of schooling varied only slightly: 75% (n = 1046) had doctoral degrees while 19%
(n = 266) had master’s degrees. In addition, 60.3% (n = 845) had 15 to 20 years of
teaching experience, and the weekly workload was 40 h for 26.2% of respondents (n
= 368), 20 h for 16.1% of respondents (n = 226), and 30 h for 13.5% of respondents
(n = 189). Of the 1400 professors surveyed, 79.5% have a working relationship with
only one educational institution (n = 1113). Table 1 shows the sociodemographic
characteristics of the professors included in the study.
Through the applied factorial analysis and the Varimax® Rotation, it was possible
to extract six principal components, as shown in Table 2.
Table 3 shows the higher factor loads that emerged from the extraction of each
Table 1 Sociodemographic
characteristics of teachers
Characteristics
Respondents
Age
n
%
26–30 years
106
8
31–35 years
143
10
36–45 years
215
15
46–55 years
752
54
+55 years
184
13
Marital status
Married/companion
1080
77
Separated/divorced
159
11.8
Single Children:
156
11
Widowed
3
0.2
Level of education/schooling
PhD
1046
75
Specialist
35
2
Master’s degree
266
19
Postdoctoral degree
50
3
Other training
3
1
Gender
Male
330
24
Female
1070
76