

Economic Complexity and the Environment: Evidence from Brazil
11
construct the ECI for Brazilian municipalities and states. As the index is not available
for Brazilian metropolitan regions, we constructed it as the average over the ECI of
Brazilian municipalities constituting the respective metropolitan regions.
Control Variables
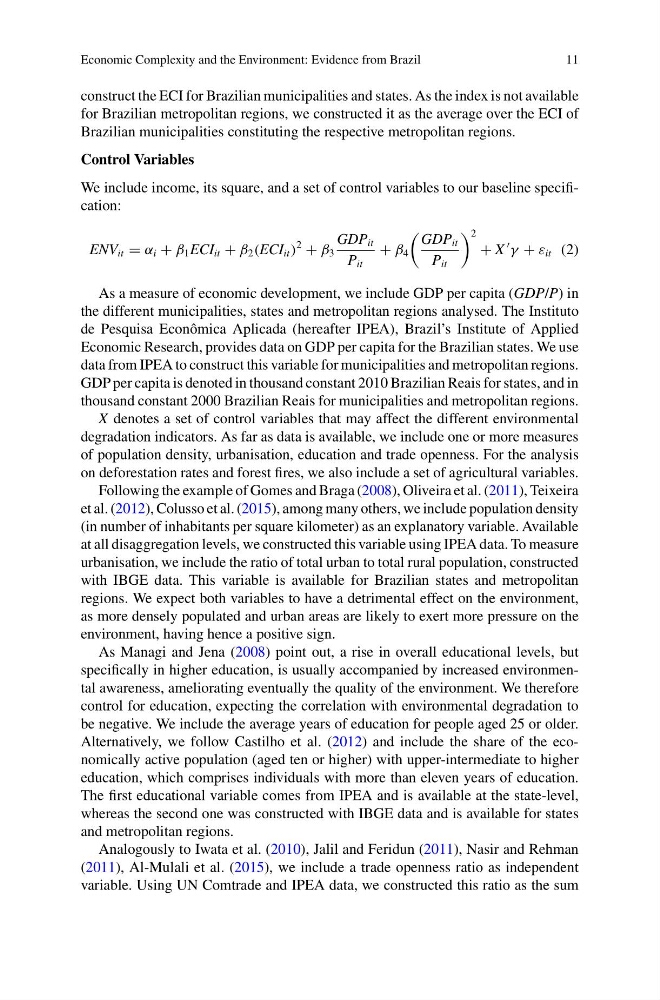
We include income, its square, and a set of control variables to our baseline specification:
ENV it = α i + β 1 ECI it + β 2 (ECI it )
2
+ β 3
GDP it
P it
+ β 4
GDP it
P it
2
+ X
γ + ε it (2)
As a measure of economic development, we include GDP per capita (GDP/P) in
the different municipalities, states and metropolitan regions analysed. The Instituto
de Pesquisa Econômica Aplicada (hereafter IPEA), Brazil’s Institute of Applied
Economic Research, provides data on GDP per capita for the Brazilian states. We use
data from IPEA to construct this variable for municipalities and metropolitan regions.
GDP per capita is denoted in thousand constant 2010 Brazilian Reais for states, and in
thousand constant 2000 Brazilian Reais for municipalities and metropolitan regions.
X denotes a set of control variables that may affect the different environmental
degradation indicators. As far as data is available, we include one or more measures
of population density, urbanisation, education and trade openness. For the analysis
on deforestation rates and forest fires, we also include a set of agricultural variables.
Following the example of Gomes and Braga (2008), Oliveira et al. (2011), Teixeira
et al. (2012), Colusso et al. (2015), among many others, we include population density
(in number of inhabitants per square kilometer) as an explanatory variable. Available
at all disaggregation levels, we constructed this variable using IPEA data. To measure
urbanisation, we include the ratio of total urban to total rural population, constructed
with IBGE data. This variable is available for Brazilian states and metropolitan
regions. We expect both variables to have a detrimental effect on the environment,
as more densely populated and urban areas are likely to exert more pressure on the
environment, having hence a positive sign.
As Managi and Jena (2008) point out, a rise in overall educational levels, but
specifically in higher education, is usually accompanied by increased environmental awareness, ameliorating eventually the quality of the environment. We therefore
control for education, expecting the correlation with environmental degradation to
be negative. We include the average years of education for people aged 25 or older.
Alternatively, we follow Castilho et al. (2012) and include the share of the economically active population (aged ten or higher) with upper-intermediate to higher
education, which comprises individuals with more than eleven years of education.
The first educational variable comes from IPEA and is available at the state-level,
whereas the second one was constructed with IBGE data and is available for states
and metropolitan regions.
Analogously to Iwata et al. (2010), Jalil and Feridun (2011), Nasir and Rehman
(2011), Al-Mulali et al. (2015), we include a trade openness ratio as independent
variable. Using UN Comtrade and IPEA data, we constructed this ratio as the sum
11
construct the ECI for Brazilian municipalities and states. As the index is not available
for Brazilian metropolitan regions, we constructed it as the average over the ECI of
Brazilian municipalities constituting the respective metropolitan regions.
Control Variables
We include income, its square, and a set of control variables to our baseline specification:
ENV it = α i + β 1 ECI it + β 2 (ECI it )
2
+ β 3
GDP it
P it
+ β 4
GDP it
P it
2
+ X
γ + ε it (2)
As a measure of economic development, we include GDP per capita (GDP/P) in
the different municipalities, states and metropolitan regions analysed. The Instituto
de Pesquisa Econômica Aplicada (hereafter IPEA), Brazil’s Institute of Applied
Economic Research, provides data on GDP per capita for the Brazilian states. We use
data from IPEA to construct this variable for municipalities and metropolitan regions.
GDP per capita is denoted in thousand constant 2010 Brazilian Reais for states, and in
thousand constant 2000 Brazilian Reais for municipalities and metropolitan regions.
X denotes a set of control variables that may affect the different environmental
degradation indicators. As far as data is available, we include one or more measures
of population density, urbanisation, education and trade openness. For the analysis
on deforestation rates and forest fires, we also include a set of agricultural variables.
Following the example of Gomes and Braga (2008), Oliveira et al. (2011), Teixeira
et al. (2012), Colusso et al. (2015), among many others, we include population density
(in number of inhabitants per square kilometer) as an explanatory variable. Available
at all disaggregation levels, we constructed this variable using IPEA data. To measure
urbanisation, we include the ratio of total urban to total rural population, constructed
with IBGE data. This variable is available for Brazilian states and metropolitan
regions. We expect both variables to have a detrimental effect on the environment,
as more densely populated and urban areas are likely to exert more pressure on the
environment, having hence a positive sign.
As Managi and Jena (2008) point out, a rise in overall educational levels, but
specifically in higher education, is usually accompanied by increased environmental awareness, ameliorating eventually the quality of the environment. We therefore
control for education, expecting the correlation with environmental degradation to
be negative. We include the average years of education for people aged 25 or older.
Alternatively, we follow Castilho et al. (2012) and include the share of the economically active population (aged ten or higher) with upper-intermediate to higher
education, which comprises individuals with more than eleven years of education.
The first educational variable comes from IPEA and is available at the state-level,
whereas the second one was constructed with IBGE data and is available for states
and metropolitan regions.
Analogously to Iwata et al. (2010), Jalil and Feridun (2011), Nasir and Rehman
(2011), Al-Mulali et al. (2015), we include a trade openness ratio as independent
variable. Using UN Comtrade and IPEA data, we constructed this ratio as the sum