

36
Rain is the third important water resource in Egypt. Rain falls in the winter only
and its amount in the Egyptian north coast varies ranging from 130 to 150 mm in the
northwestern coast and from 80 mm (west of Al-Arish) to 280 mm (at Rafah) in the
northeastern coast. This rate decreases after 20 kilometers south of the Mediterranean
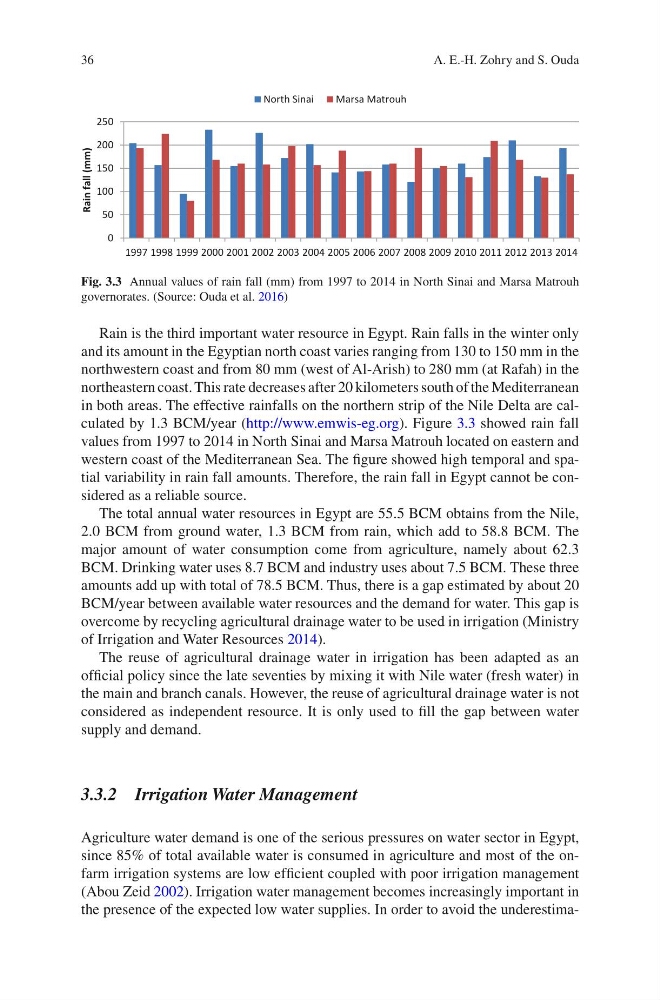
in both areas. The effective rainfalls on the northern strip of the Nile Delta are calculated by 1.3 BCM/year (http://www.emwis-eg.org). Figure 3.3 showed rain fall
values from 1997 to 2014 in North Sinai and Marsa Matrouh located on eastern and
western coast of the Mediterranean Sea. The figure showed high temporal and spatial variability in rain fall amounts. Therefore, the rain fall in Egypt cannot be considered as a reliable source.
The total annual water resources in Egypt are 55.5 BCM obtains from the Nile,
2.0 BCM from ground water, 1.3 BCM from rain, which add to 58.8 BCM. The
major amount of water consumption come from agriculture, namely about 62.3
BCM. Drinking water uses 8.7 BCM and industry uses about 7.5 BCM. These three
amounts add up with total of 78.5 BCM. Thus, there is a gap estimated by about 20
BCM/year between available water resources and the demand for water. This gap is
overcome by recycling agricultural drainage water to be used in irrigation (Ministry
of Irrigation and Water Resources 2014).
The reuse of agricultural drainage water in irrigation has been adapted as an
official policy since the late seventies by mixing it with Nile water (fresh water) in
the main and branch canals. However, the reuse of agricultural drainage water is not
considered as independent resource. It is only used to fill the gap between water
supply and demand.
3.3.2 Irrigation Water Management
Agriculture water demand is one of the serious pressures on water sector in Egypt,
since 85% of total available water is consumed in agriculture and most of the onfarm irrigation systems are low efficient coupled with poor irrigation management
(Abou Zeid 2002). Irrigation water management becomes increasingly important in
the presence of the expected low water supplies. In order to avoid the underestima0
50
100
150
200
250
1997 1998 1999 2000 2001 2002 2003 2004 2005 2006 2007 2008 2009 2010 2011 2012 2013 2014
Rain fall (mm)
North Sinai
Marsa Matrouh
Fig. 3.3 Annual values of rain fall (mm) from 1997 to 2014 in North Sinai and Marsa Matrouh
governorates. (Source: Ouda et al. 2016)
A. E.-H. Zohry and S. Ouda
Rain is the third important water resource in Egypt. Rain falls in the winter only
and its amount in the Egyptian north coast varies ranging from 130 to 150 mm in the
northwestern coast and from 80 mm (west of Al-Arish) to 280 mm (at Rafah) in the
northeastern coast. This rate decreases after 20 kilometers south of the Mediterranean
in both areas. The effective rainfalls on the northern strip of the Nile Delta are calculated by 1.3 BCM/year (http://www.emwis-eg.org). Figure 3.3 showed rain fall
values from 1997 to 2014 in North Sinai and Marsa Matrouh located on eastern and
western coast of the Mediterranean Sea. The figure showed high temporal and spatial variability in rain fall amounts. Therefore, the rain fall in Egypt cannot be considered as a reliable source.
The total annual water resources in Egypt are 55.5 BCM obtains from the Nile,
2.0 BCM from ground water, 1.3 BCM from rain, which add to 58.8 BCM. The
major amount of water consumption come from agriculture, namely about 62.3
BCM. Drinking water uses 8.7 BCM and industry uses about 7.5 BCM. These three
amounts add up with total of 78.5 BCM. Thus, there is a gap estimated by about 20
BCM/year between available water resources and the demand for water. This gap is
overcome by recycling agricultural drainage water to be used in irrigation (Ministry
of Irrigation and Water Resources 2014).
The reuse of agricultural drainage water in irrigation has been adapted as an
official policy since the late seventies by mixing it with Nile water (fresh water) in
the main and branch canals. However, the reuse of agricultural drainage water is not
considered as independent resource. It is only used to fill the gap between water
supply and demand.
3.3.2 Irrigation Water Management
Agriculture water demand is one of the serious pressures on water sector in Egypt,
since 85% of total available water is consumed in agriculture and most of the onfarm irrigation systems are low efficient coupled with poor irrigation management
(Abou Zeid 2002). Irrigation water management becomes increasingly important in
the presence of the expected low water supplies. In order to avoid the underestima0
50
100
150
200
250
1997 1998 1999 2000 2001 2002 2003 2004 2005 2006 2007 2008 2009 2010 2011 2012 2013 2014
Rain fall (mm)
North Sinai
Marsa Matrouh
Fig. 3.3 Annual values of rain fall (mm) from 1997 to 2014 in North Sinai and Marsa Matrouh
governorates. (Source: Ouda et al. 2016)
A. E.-H. Zohry and S. Ouda