

19.3.2.2 Contaminant Concentrations Throughout the Test
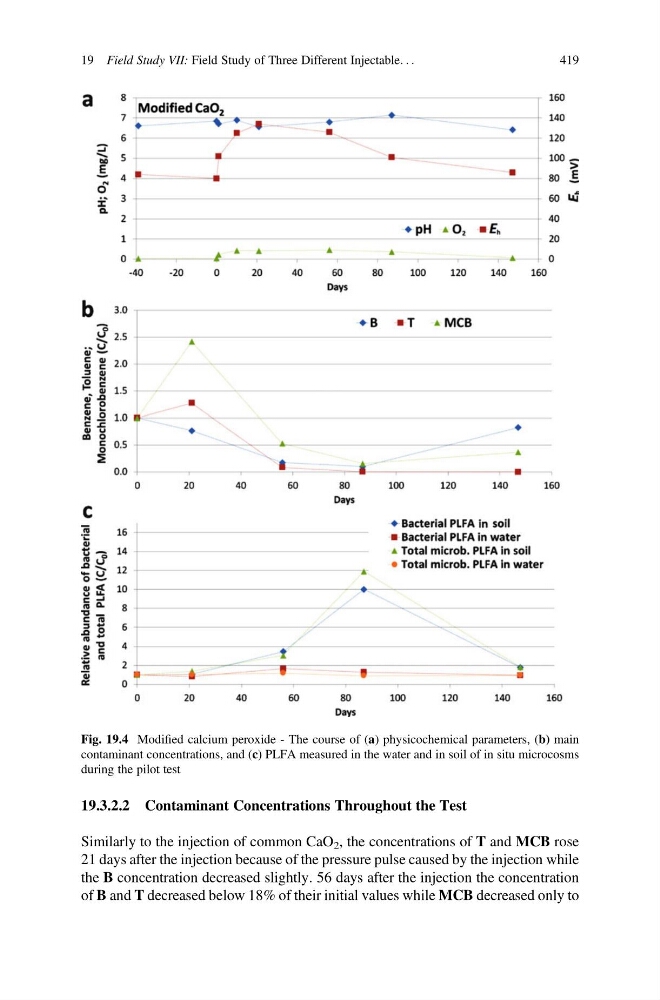
Similarly to the injection of common CaO 2 , the concentrations of T and MCB rose
21 days after the injection because of the pressure pulse caused by the injection while
the B concentration decreased slightly. 56 days after the injection the concentration
of B and T decreased below 18% of their initial values while MCB decreased only to
Fig. 19.4 Modified calcium peroxide - The course of (a) physicochemical parameters, (b) main
contaminant concentrations, and (c) PLFA measured in the water and in soil of in situ microcosms
during the pilot test
19 Field Study VII: Field Study of Three Different Injectable. . .
419
Similarly to the injection of common CaO 2 , the concentrations of T and MCB rose
21 days after the injection because of the pressure pulse caused by the injection while
the B concentration decreased slightly. 56 days after the injection the concentration
of B and T decreased below 18% of their initial values while MCB decreased only to
Fig. 19.4 Modified calcium peroxide - The course of (a) physicochemical parameters, (b) main
contaminant concentrations, and (c) PLFA measured in the water and in soil of in situ microcosms
during the pilot test
19 Field Study VII: Field Study of Three Different Injectable. . .
419