

2. Measure the absorbance of the aqueous solution at 510 nm (or 505 nm). In the
literature, it is recommended that both of these wavelengths should be used for
measuring the concertation of Fe(VI) in aqueous solution. The Fe(VI) spectrum
has a broader peak in this area, i.e., both variants are correct. When comparing
UV–VIS spectra of ferrates and permanganate, it is clear that measuring at
510 nm is not sufficient for distinguishing a ferrate solution from permanganate
(see Fig. 13.6a, b).
3. Ferrates can contain traces of heavy metals (Cr, Ni, V, Cu, etc.). Although, it is
convenient to use ferrates at very low concentrations even from economic point of
view (dozens of mg/L), it is still recommended that the final content of heavy
metals in the remediated water in which ferrates were applied should be checked.
4. When in solutions with demineralized water, ferrates will show greater efficiency.
Nevertheless, such a ferrate is unstable and requires fast processing. When in
solutions with drinking water, ferrates will be more stable (1–2 h), but their
reaction will take more time.
13.6.4 Waste Products
The amount of waste products was evaluated after completing the test in KLU
locality. Within this testing, 516 L of water containing 0.1 mg/L of arsenic was
processed under different technological conditions, meaning different ENVIFER
doses.
Sand filter, microfiltration (2 pcs), and ultrafiltration separated out ferrate-reaction
products containing arsenic from the water having been treated. Filtration units from
microfiltration and ultrafiltration showed only slightly yellowish color; neither of
them showed any fall in pressure (indication of pore clogging), i.e., they were
preserved for the following tests. The sand filter was cleaned using a standard
method, i.e., by counter-current flushing with five units of drinking water equalling
five units of the sand filter content. The filling volume of the sand filter was 35 L, the
total volume of the cleaning water was 175 L (5 Â 35 L). The cleaning water was
collected in a container. After the process of cleaning the filter had been finished,
samples were collected for chemical analysis in an accredited laboratory ALS.
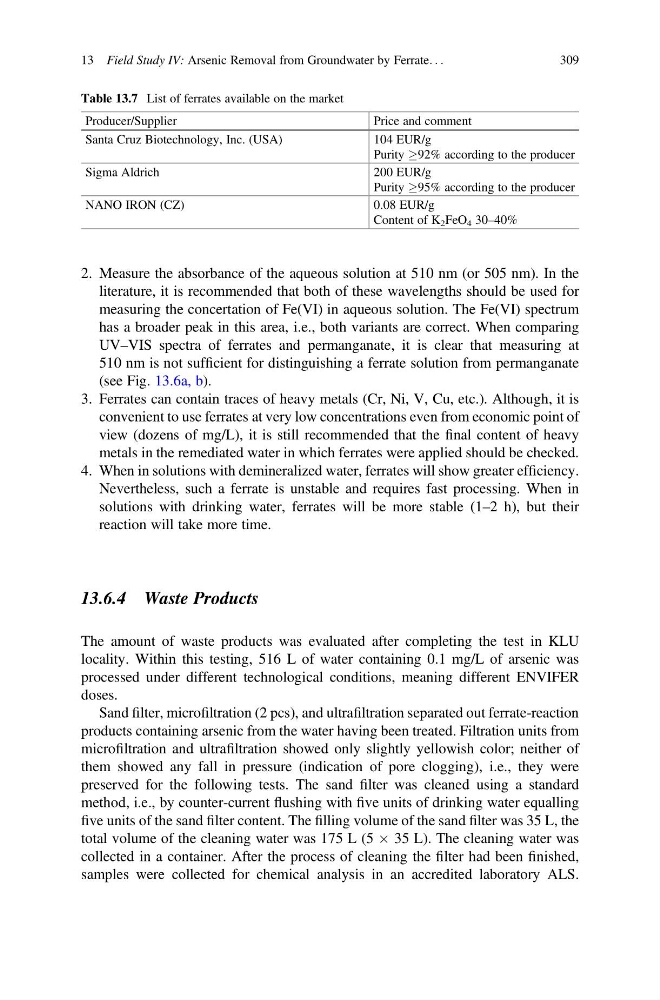
Table 13.7 List of ferrates available on the market
Producer/Supplier
Price and comment
Santa Cruz Biotechnology, Inc. (USA)
104 EUR/g
Purity !92% according to the producer
Sigma Aldrich
200 EUR/g
Purity !95% according to the producer
NANO IRON (CZ)
0.08 EUR/g
Content of K 2 FeO 4 30–40%
13 Field Study IV: Arsenic Removal from Groundwater by Ferrate. . .
309
literature, it is recommended that both of these wavelengths should be used for
measuring the concertation of Fe(VI) in aqueous solution. The Fe(VI) spectrum
has a broader peak in this area, i.e., both variants are correct. When comparing
UV–VIS spectra of ferrates and permanganate, it is clear that measuring at
510 nm is not sufficient for distinguishing a ferrate solution from permanganate
(see Fig. 13.6a, b).
3. Ferrates can contain traces of heavy metals (Cr, Ni, V, Cu, etc.). Although, it is
convenient to use ferrates at very low concentrations even from economic point of
view (dozens of mg/L), it is still recommended that the final content of heavy
metals in the remediated water in which ferrates were applied should be checked.
4. When in solutions with demineralized water, ferrates will show greater efficiency.
Nevertheless, such a ferrate is unstable and requires fast processing. When in
solutions with drinking water, ferrates will be more stable (1–2 h), but their
reaction will take more time.
13.6.4 Waste Products
The amount of waste products was evaluated after completing the test in KLU
locality. Within this testing, 516 L of water containing 0.1 mg/L of arsenic was
processed under different technological conditions, meaning different ENVIFER
doses.
Sand filter, microfiltration (2 pcs), and ultrafiltration separated out ferrate-reaction
products containing arsenic from the water having been treated. Filtration units from
microfiltration and ultrafiltration showed only slightly yellowish color; neither of
them showed any fall in pressure (indication of pore clogging), i.e., they were
preserved for the following tests. The sand filter was cleaned using a standard
method, i.e., by counter-current flushing with five units of drinking water equalling
five units of the sand filter content. The filling volume of the sand filter was 35 L, the
total volume of the cleaning water was 175 L (5 Â 35 L). The cleaning water was
collected in a container. After the process of cleaning the filter had been finished,
samples were collected for chemical analysis in an accredited laboratory ALS.
Table 13.7 List of ferrates available on the market
Producer/Supplier
Price and comment
Santa Cruz Biotechnology, Inc. (USA)
104 EUR/g
Purity !92% according to the producer
Sigma Aldrich
200 EUR/g
Purity !95% according to the producer
NANO IRON (CZ)
0.08 EUR/g
Content of K 2 FeO 4 30–40%
13 Field Study IV: Arsenic Removal from Groundwater by Ferrate. . .
309