

groundwater was monitored by conducting groundwater level measurement; the
measurement of ORP, pH, conductivity, temperature, and dissolved oxygen; and
analysis of chlorinated hydrocarbons (CHC), total iron, bromides, and nontoxic
degradation products of in situ chemical reduction. The samples were always
taken the moment the above-mentioned parameters were stabilized.
6.3 Tracer Test
A tracer test was performed with the aim to trace the migration pathway of the
contaminants, estimate travel velocity, and dispersion parameters in the highly
contaminated groundwater of B149, where CHC exceeded 60 mg/L in total. Three
kilograms of KBr diluted in 1000 L of technological water was applied. The
concentration of bromide cation in the solution was 2 g/L. The application of the
tracer into B149 was performed on a stable water level. The natural groundwater
level was increased by 50 cm and the continuous application took 23 h.
The isolines of tracer at different times (day 1, day 2, day 6, and day 13; Figs. 6.2,
6.3, 6.4 and 6.5) show relatively constant progress of the tracer movement. Figure 6.6
illustrates the tracer-breakthrough curves for Br
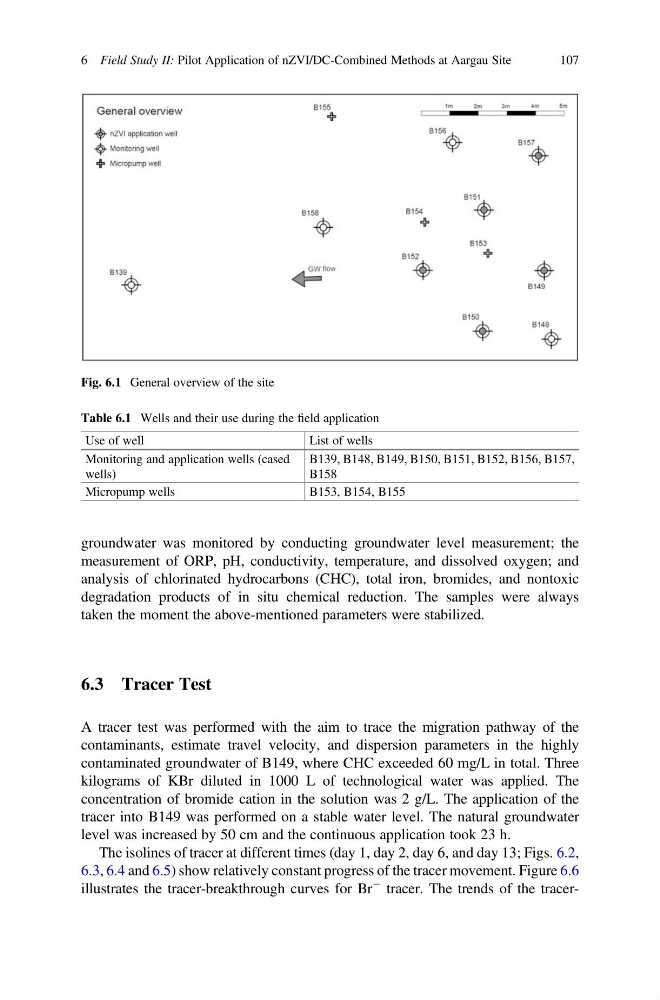
À tracer. The trends of the tracerFig. 6.1 General overview of the site
Table 6.1 Wells and their use during the field application
Use of well
List of wells
Monitoring and application wells (cased
wells)
B139, B148, B149, B150, B151, B152, B156, B157,
B158
Micropump wells
B153, B154, B155
6 Field Study II: Pilot Application of nZVI/DC-Combined Methods at Aargau Site
107
measurement of ORP, pH, conductivity, temperature, and dissolved oxygen; and
analysis of chlorinated hydrocarbons (CHC), total iron, bromides, and nontoxic
degradation products of in situ chemical reduction. The samples were always
taken the moment the above-mentioned parameters were stabilized.
6.3 Tracer Test
A tracer test was performed with the aim to trace the migration pathway of the
contaminants, estimate travel velocity, and dispersion parameters in the highly
contaminated groundwater of B149, where CHC exceeded 60 mg/L in total. Three
kilograms of KBr diluted in 1000 L of technological water was applied. The
concentration of bromide cation in the solution was 2 g/L. The application of the
tracer into B149 was performed on a stable water level. The natural groundwater
level was increased by 50 cm and the continuous application took 23 h.
The isolines of tracer at different times (day 1, day 2, day 6, and day 13; Figs. 6.2,
6.3, 6.4 and 6.5) show relatively constant progress of the tracer movement. Figure 6.6
illustrates the tracer-breakthrough curves for Br
À tracer. The trends of the tracerFig. 6.1 General overview of the site
Table 6.1 Wells and their use during the field application
Use of well
List of wells
Monitoring and application wells (cased
wells)
B139, B148, B149, B150, B151, B152, B156, B157,
B158
Micropump wells
B153, B154, B155
6 Field Study II: Pilot Application of nZVI/DC-Combined Methods at Aargau Site
107