

4.3.2.2 Evaluation of the Course of E h
The nZVI application prior to electrokinetics caused a temporal decrease in the E h
values. In well IS4, the first and second applications of nZVI led to a decrease from
the original value of +440 mV to values around 0 mV and then a gradual return to
positive values (Fig. 4.16). After the DC field was connected, there was a significant
gradual decrease in the area of the cathode (well IS4-CAT). The decrease after
2.5 months was to À650 mV and the value remained low for about 8 months before
it increased owing to the anode degradation. This process was repeated after every
replacement of the anodes. At the end of the experiment (M63) the E h increased to
+160 mV, signalizing the end of the electrode’s life and simultaneously the nZVI
reductive power. The effects of the changes in the E h were also observed while
monitoring well IS4, although there was only a slight decrease.
4.3.2.3 Evaluation of the Course of Total ClE
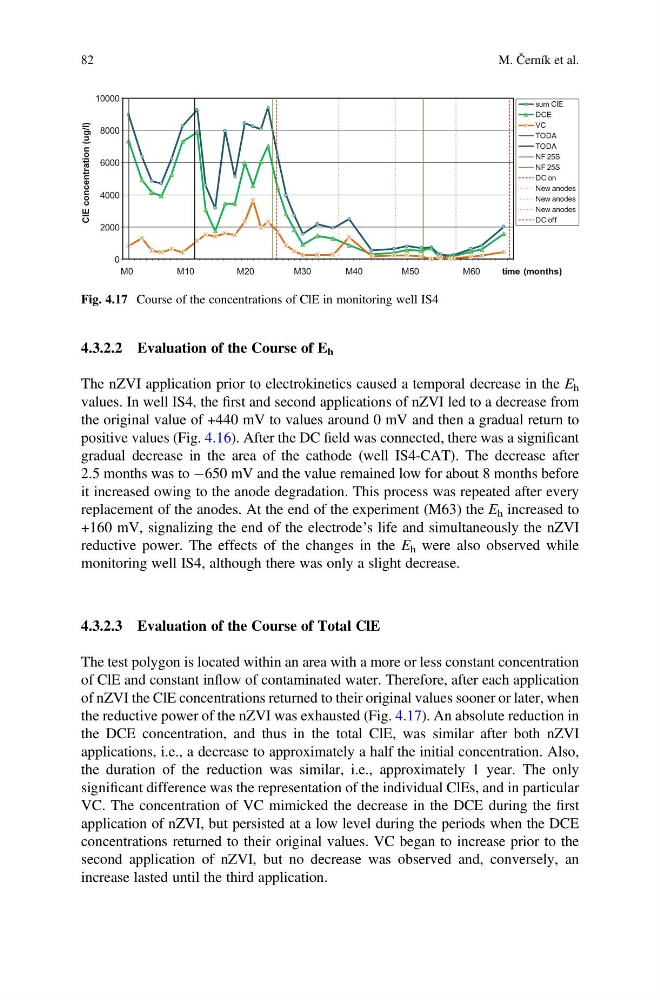
The test polygon is located within an area with a more or less constant concentration
of ClE and constant inflow of contaminated water. Therefore, after each application
of nZVI the ClE concentrations returned to their original values sooner or later, when
the reductive power of the nZVI was exhausted (Fig. 4.17). An absolute reduction in
the DCE concentration, and thus in the total ClE, was similar after both nZVI
applications, i.e., a decrease to approximately a half the initial concentration. Also,
the duration of the reduction was similar, i.e., approximately 1 year. The only
significant difference was the representation of the individual ClEs, and in particular
VC. The concentration of VC mimicked the decrease in the DCE during the first
application of nZVI, but persisted at a low level during the periods when the DCE
concentrations returned to their original values. VC began to increase prior to the
second application of nZVI, but no decrease was observed and, conversely, an
increase lasted until the third application.
0
2000
4000
6000
8000
10000
ClE concentration (ug/l)
sum ClE
DCE
VC
TODA
TODA
NF 25S
NF 25S
DC on
New anodes
New anodes
New anodes
DC off
time (months)
M0
M10
M20
M30
M40
M50
M60
Fig. 4.17 Course of the concentrations of ClE in monitoring well IS4
82
M. Černík et al.
The nZVI application prior to electrokinetics caused a temporal decrease in the E h
values. In well IS4, the first and second applications of nZVI led to a decrease from
the original value of +440 mV to values around 0 mV and then a gradual return to
positive values (Fig. 4.16). After the DC field was connected, there was a significant
gradual decrease in the area of the cathode (well IS4-CAT). The decrease after
2.5 months was to À650 mV and the value remained low for about 8 months before
it increased owing to the anode degradation. This process was repeated after every
replacement of the anodes. At the end of the experiment (M63) the E h increased to
+160 mV, signalizing the end of the electrode’s life and simultaneously the nZVI
reductive power. The effects of the changes in the E h were also observed while
monitoring well IS4, although there was only a slight decrease.
4.3.2.3 Evaluation of the Course of Total ClE
The test polygon is located within an area with a more or less constant concentration
of ClE and constant inflow of contaminated water. Therefore, after each application
of nZVI the ClE concentrations returned to their original values sooner or later, when
the reductive power of the nZVI was exhausted (Fig. 4.17). An absolute reduction in
the DCE concentration, and thus in the total ClE, was similar after both nZVI
applications, i.e., a decrease to approximately a half the initial concentration. Also,
the duration of the reduction was similar, i.e., approximately 1 year. The only
significant difference was the representation of the individual ClEs, and in particular
VC. The concentration of VC mimicked the decrease in the DCE during the first
application of nZVI, but persisted at a low level during the periods when the DCE
concentrations returned to their original values. VC began to increase prior to the
second application of nZVI, but no decrease was observed and, conversely, an
increase lasted until the third application.
0
2000
4000
6000
8000
10000
ClE concentration (ug/l)
sum ClE
DCE
VC
TODA
TODA
NF 25S
NF 25S
DC on
New anodes
New anodes
New anodes
DC off
time (months)
M0
M10
M20
M30
M40
M50
M60
Fig. 4.17 Course of the concentrations of ClE in monitoring well IS4
82
M. Černík et al.