

oxygenated constituents, one at 532.19 eV for C–OH and the other at 533.15 eV
for (C–O–C).
X-ray diffraction (XRD) is a useful tool to characterize graphite and graphene
oxide. This technique was carried out to determine d-spacing value as well as to
confirm the GO synthesis. The XRD spectra of graphite and GO were depicted in
Fig. 5. For graphite, there observed one sharp peak at 2h values 26.4° for
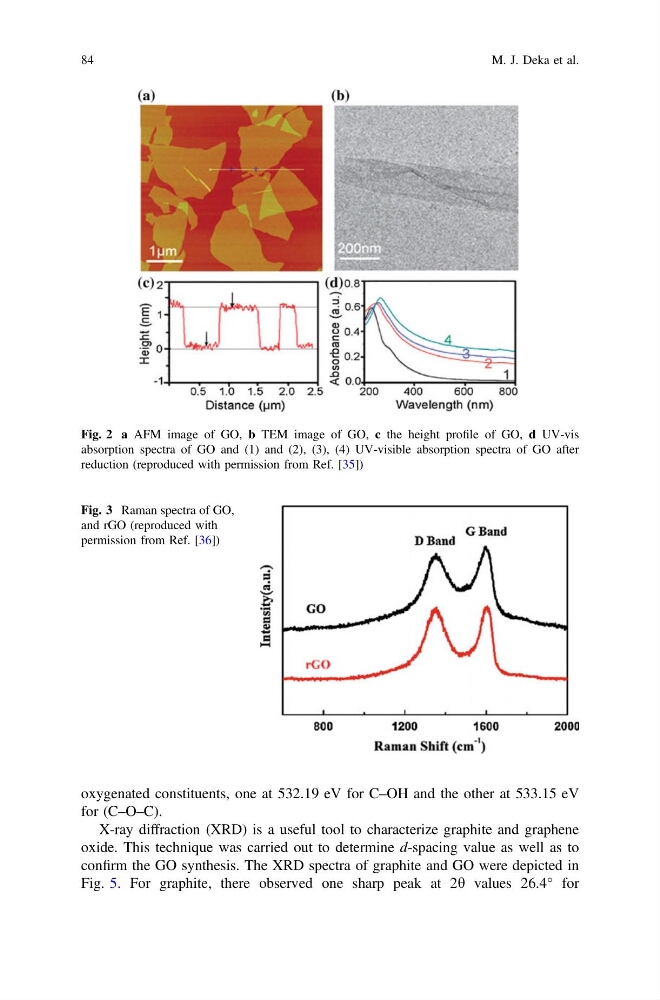
Fig. 2 a AFM image of GO, b TEM image of GO, c the height profile of GO, d UV-vis
absorption spectra of GO and (1) and (2), (3), (4) UV-visible absorption spectra of GO after
reduction (reproduced with permission from Ref. [35])
Fig. 3 Raman spectra of GO,
and rGO (reproduced with
permission from Ref. [36])
84
M. J. Deka et al.
for (C–O–C).
X-ray diffraction (XRD) is a useful tool to characterize graphite and graphene
oxide. This technique was carried out to determine d-spacing value as well as to
confirm the GO synthesis. The XRD spectra of graphite and GO were depicted in
Fig. 5. For graphite, there observed one sharp peak at 2h values 26.4° for
Fig. 2 a AFM image of GO, b TEM image of GO, c the height profile of GO, d UV-vis
absorption spectra of GO and (1) and (2), (3), (4) UV-visible absorption spectra of GO after
reduction (reproduced with permission from Ref. [35])
Fig. 3 Raman spectra of GO,
and rGO (reproduced with
permission from Ref. [36])
84
M. J. Deka et al.