

enables a specific detection of individual compounds also in mixtures that cannot be
fully separated by chromatography. Furthermore, the sensitivity of such analyses is
commonly high.
4.2.2 Mass Spectra
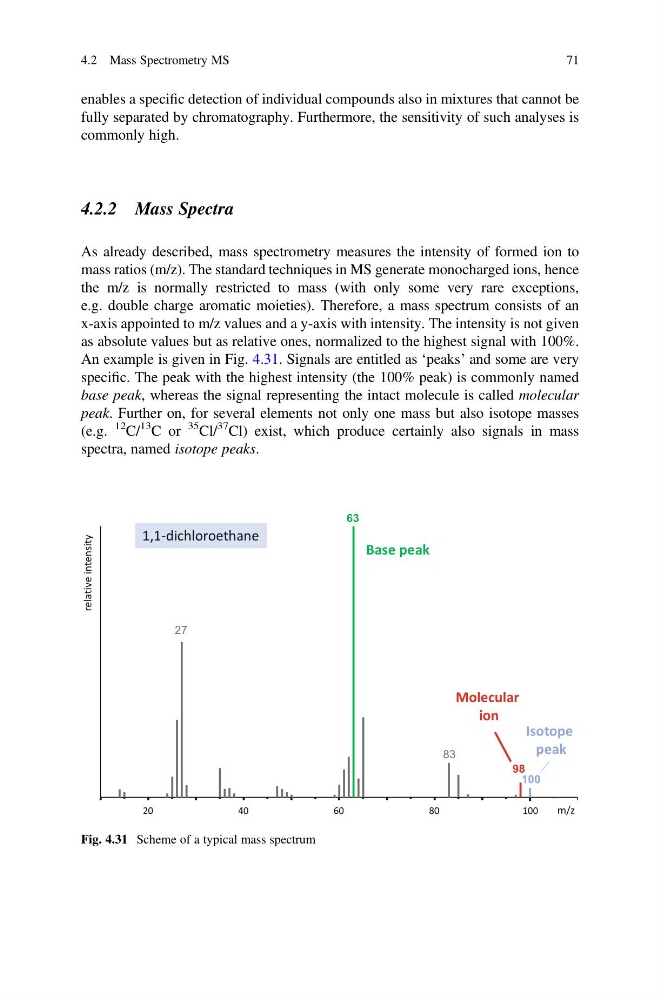
As already described, mass spectrometry measures the intensity of formed ion to
mass ratios (m/z). The standard techniques in MS generate monocharged ions, hence
the m/z is normally restricted to mass (with only some very rare exceptions,
e.g. double charge aromatic moieties). Therefore, a mass spectrum consists of an
x-axis appointed to m/z values and a y-axis with intensity. The intensity is not given
as absolute values but as relative ones, normalized to the highest signal with 100%.
An example is given in Fig. 4.31. Signals are entitled as ‘peaks’ and some are very
specific. The peak with the highest intensity (the 100% peak) is commonly named
base peak, whereas the signal representing the intact molecule is called molecular
peak. Further on, for several elements not only one mass but also isotope masses
(e.g.
12 C/
13 C or
35 Cl/
37 Cl) exist, which produce certainly also signals in mass
spectra, named isotope peaks.
60
80
100
20
40
27
63
83
98
100
y
t
i
s
n
e
t
n
i
e
v
i
t
a
l
e
r
m/z
Base peak
Molecular
ion
Isotope
peak
1,1-dichloroethane
Fig. 4.31 Scheme of a typical mass spectrum
4.2 Mass Spectrometry MS
71
fully separated by chromatography. Furthermore, the sensitivity of such analyses is
commonly high.
4.2.2 Mass Spectra
As already described, mass spectrometry measures the intensity of formed ion to
mass ratios (m/z). The standard techniques in MS generate monocharged ions, hence
the m/z is normally restricted to mass (with only some very rare exceptions,
e.g. double charge aromatic moieties). Therefore, a mass spectrum consists of an
x-axis appointed to m/z values and a y-axis with intensity. The intensity is not given
as absolute values but as relative ones, normalized to the highest signal with 100%.
An example is given in Fig. 4.31. Signals are entitled as ‘peaks’ and some are very
specific. The peak with the highest intensity (the 100% peak) is commonly named
base peak, whereas the signal representing the intact molecule is called molecular
peak. Further on, for several elements not only one mass but also isotope masses
(e.g.
12 C/
13 C or
35 Cl/
37 Cl) exist, which produce certainly also signals in mass
spectra, named isotope peaks.
60
80
100
20
40
27
63
83
98
100
y
t
i
s
n
e
t
n
i
e
v
i
t
a
l
e
r
m/z
Base peak
Molecular
ion
Isotope
peak
1,1-dichloroethane
Fig. 4.31 Scheme of a typical mass spectrum
4.2 Mass Spectrometry MS
71