

reduced to volumes of approx. 0.5–2 mL by rotary evaporation prior to fractionation
or another coarse separation.
For fractionation the application of first order chromatography is limited. Thin
layer chromatography is the most common practice using sheets (glass, plastic or
Resolut ion
Separat ion
capacity
low
high
low
high
w = 4 α
0.134
1.000
50 % of
original peak
width
Ideal peak shape
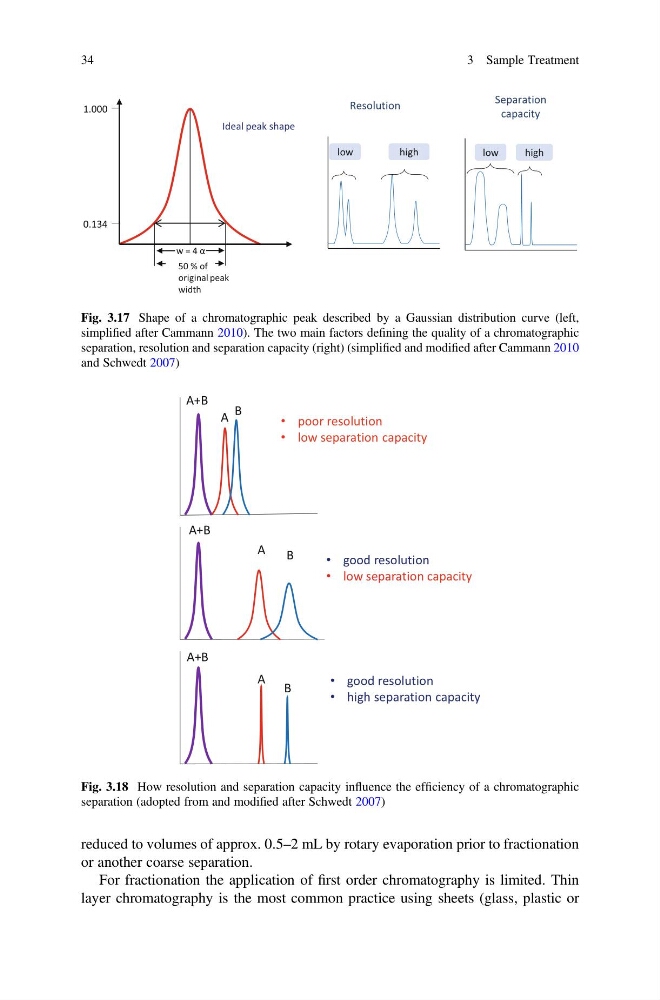
Fig. 3.17 Shape of a chromatographic peak described by a Gaussian distribution curve (left,
simplified after Cammann 2010). The two main factors defining the quality of a chromatographic
separation, resolution and separation capacity (right) (simplified and modified after Cammann 2010
and Schwedt 2007)
A+B
B
A
• poor resolut ion
• low separat ion capacity
A+B
A B
• good resolut ion
• high separat ion capacity
A+B
A
B
• good resolut ion
• low separat ion capacity
Fig. 3.18 How resolution and separation capacity influence the efficiency of a chromatographic
separation (adopted from and modified after Schwedt 2007)
34
3 Sample Treatment
or another coarse separation.
For fractionation the application of first order chromatography is limited. Thin
layer chromatography is the most common practice using sheets (glass, plastic or
Resolut ion
Separat ion
capacity
low
high
low
high
w = 4 α
0.134
1.000
50 % of
original peak
width
Ideal peak shape
Fig. 3.17 Shape of a chromatographic peak described by a Gaussian distribution curve (left,
simplified after Cammann 2010). The two main factors defining the quality of a chromatographic
separation, resolution and separation capacity (right) (simplified and modified after Cammann 2010
and Schwedt 2007)
A+B
B
A
• poor resolut ion
• low separat ion capacity
A+B
A B
• good resolut ion
• high separat ion capacity
A+B
A
B
• good resolut ion
• low separat ion capacity
Fig. 3.18 How resolution and separation capacity influence the efficiency of a chromatographic
separation (adopted from and modified after Schwedt 2007)
34
3 Sample Treatment