

subsequent measurement of a 1 μL aliquot by GC/MS. A surrogate standard
has been added to the relevant fraction. The total procedure has been applied
additionally to a precleaned sand sample spiked with the analyte at a concentration level that was expected also for the environmental sample. This recovery run has been performed three times revealing a recovery rate of 83%
(Æ15% rel. standard deviation). A blank procedure performed on a precleaned
sand sample revealed a laboratory contamination by the analyte at a level of
0.15 ng per analysis.
The GC/MS system has been calibrated with an external four-point calibration including the surrogate standard. The results from both, the calibration
runs as well as the sample analyses are given in the following table:
Analysis
Concentration
analyte (ng/μL)
Peak area
(analyte)
Peak area
(surrogate
standard)
Peak area analyte
normalized to surrogate
standard
Calibration
Std 1
50
1,250,970 100,050
12.50
Calibration
Std 2
25
605,350
99,850
6.06
Calibration
Std 3
10
255,580 101,150
2.53
Calibration
Std 4
5
115,100 100,030
1.15
Soil extract Unknown
550,780
98,950
5.57
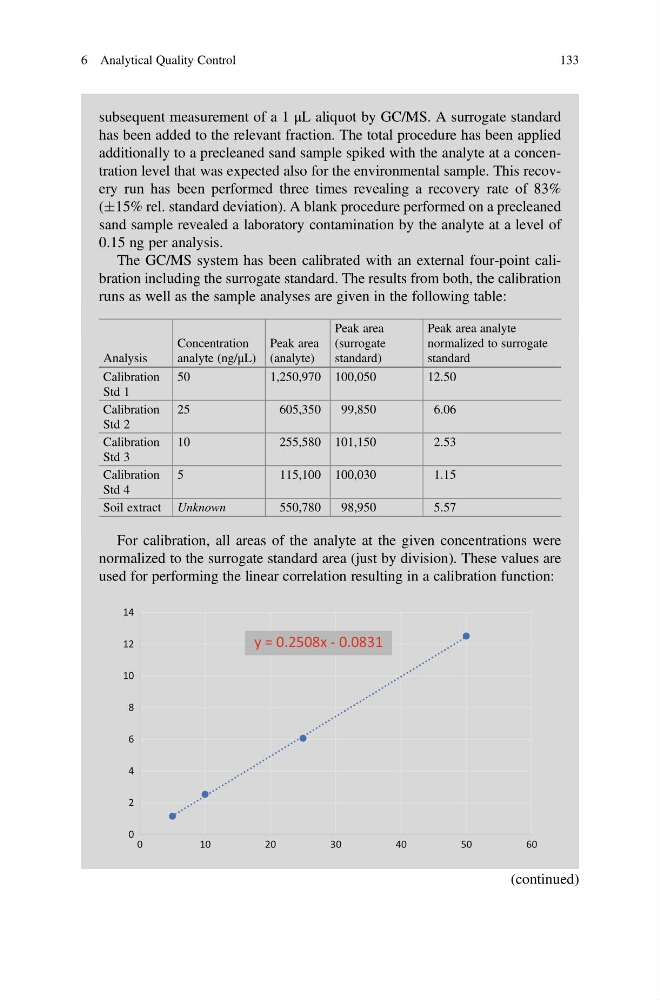
For calibration, all areas of the analyte at the given concentrations were
normalized to the surrogate standard area (just by division). These values are
used for performing the linear correlation resulting in a calibration function:
y = 0.2508x - 0.0831
0
2
4
6
8
10
12
14
0
1 0
2 0
3 0
4 0
5 0
6 0
(continued)
6 Analytical Quality Control
133
has been added to the relevant fraction. The total procedure has been applied
additionally to a precleaned sand sample spiked with the analyte at a concentration level that was expected also for the environmental sample. This recovery run has been performed three times revealing a recovery rate of 83%
(Æ15% rel. standard deviation). A blank procedure performed on a precleaned
sand sample revealed a laboratory contamination by the analyte at a level of
0.15 ng per analysis.
The GC/MS system has been calibrated with an external four-point calibration including the surrogate standard. The results from both, the calibration
runs as well as the sample analyses are given in the following table:
Analysis
Concentration
analyte (ng/μL)
Peak area
(analyte)
Peak area
(surrogate
standard)
Peak area analyte
normalized to surrogate
standard
Calibration
Std 1
50
1,250,970 100,050
12.50
Calibration
Std 2
25
605,350
99,850
6.06
Calibration
Std 3
10
255,580 101,150
2.53
Calibration
Std 4
5
115,100 100,030
1.15
Soil extract Unknown
550,780
98,950
5.57
For calibration, all areas of the analyte at the given concentrations were
normalized to the surrogate standard area (just by division). These values are
used for performing the linear correlation resulting in a calibration function:
y = 0.2508x - 0.0831
0
2
4
6
8
10
12
14
0
1 0
2 0
3 0
4 0
5 0
6 0
(continued)
6 Analytical Quality Control
133