

been proven. One can address sensitivity for a target analyte determined by a defined
analytical system e.g. GC/MS. But sensitivity can be determined also more comprehensively by including also the sample matrix.
A simple approach for determination of sensitivity for an analytical system, the
data obtained from calibration processes can be used. Having a look on the external
standard calibration approach, the basic component is the linear calibration function.
The intersection of the linear curve with the x-axis marks a point at which for given
concentration no peak area can be determined any more. This situation characterizes
the limit of quantitation LOQ for the analytical system. Consequently, during
external calibration the LOQ for a given system can easily be calculated. However,
since this method solely is based on measurements of standard solutions, the matrix
effects on the sensitivity are not considered. A second approach can be applied also
for the measurements of real samples. It uses the noise of a measurements and its
correlation with the signal intensity, the so-called signal-to-noise ratio (S/N ratio).
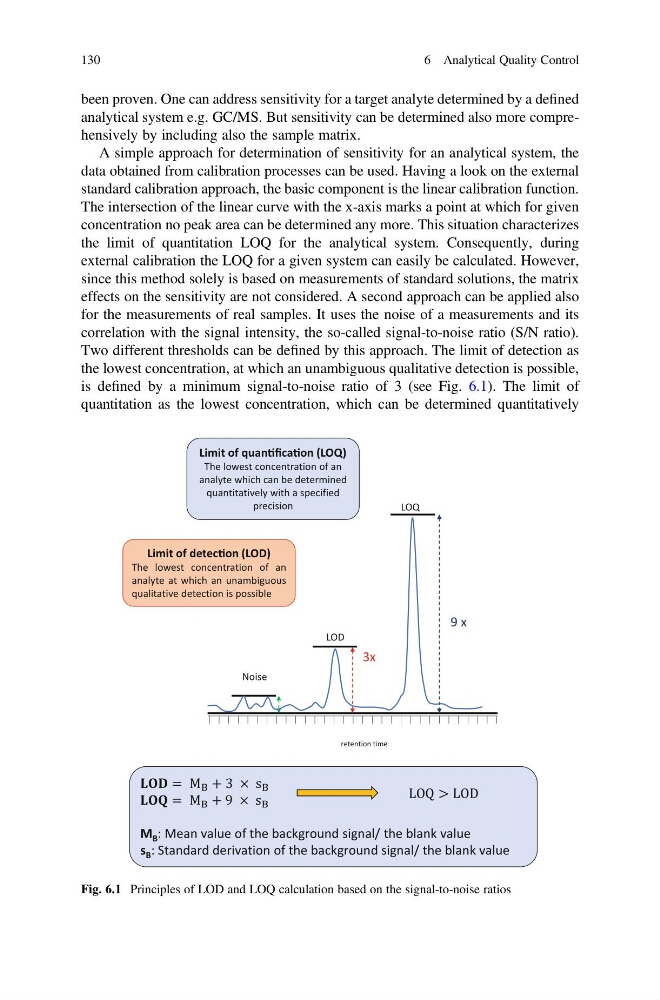
Two different thresholds can be defined by this approach. The limit of detection as
the lowest concentration, at which an unambiguous qualitative detection is possible,
is defined by a minimum signal-to-noise ratio of 3 (see Fig. 6.1). The limit of
quantitation as the lowest concentration, which can be determined quantitatively
retention time
Noise
LOD
LOQ
Limit of detecƟon (LOD)
The lowest concentration of an
analyte at which an unambiguous
qualitative detection is possible
Limit of quanƟficaƟon (LOQ)
The lowest concentration of an
analyte which can be determined
quantitatively with a specified
precision
= M + 3 × s
= M + 9 × s
M B : Mean value of the background signal/ the blank value
s B : Standard derivation of the background signal/ the blank value
LOQ > LOD
3x
9 x
Fig. 6.1 Principles of LOD and LOQ calculation based on the signal-to-noise ratios
130
6 Analytical Quality Control
analytical system e.g. GC/MS. But sensitivity can be determined also more comprehensively by including also the sample matrix.
A simple approach for determination of sensitivity for an analytical system, the
data obtained from calibration processes can be used. Having a look on the external
standard calibration approach, the basic component is the linear calibration function.
The intersection of the linear curve with the x-axis marks a point at which for given
concentration no peak area can be determined any more. This situation characterizes
the limit of quantitation LOQ for the analytical system. Consequently, during
external calibration the LOQ for a given system can easily be calculated. However,
since this method solely is based on measurements of standard solutions, the matrix
effects on the sensitivity are not considered. A second approach can be applied also
for the measurements of real samples. It uses the noise of a measurements and its
correlation with the signal intensity, the so-called signal-to-noise ratio (S/N ratio).
Two different thresholds can be defined by this approach. The limit of detection as
the lowest concentration, at which an unambiguous qualitative detection is possible,
is defined by a minimum signal-to-noise ratio of 3 (see Fig. 6.1). The limit of
quantitation as the lowest concentration, which can be determined quantitatively
retention time
Noise
LOD
LOQ
Limit of detecƟon (LOD)
The lowest concentration of an
analyte at which an unambiguous
qualitative detection is possible
Limit of quanƟficaƟon (LOQ)
The lowest concentration of an
analyte which can be determined
quantitatively with a specified
precision
= M + 3 × s
= M + 9 × s
M B : Mean value of the background signal/ the blank value
s B : Standard derivation of the background signal/ the blank value
LOQ > LOD
3x
9 x
Fig. 6.1 Principles of LOD and LOQ calculation based on the signal-to-noise ratios
130
6 Analytical Quality Control