

stability at secondary carbon atoms is higher as compared to those of tertiary ones.
Hence, a fragmentation at tertiary carbon atoms is thermodynamically preferred and,
consequently, the peak intensity for ions derived from these fragmentations is
enhanced. A simple interpretation is illustrated for 6-propylhexadecane in
Fig. 5.3a. This principal approach accounts certainly also for alkanes with several
branching, as exemplified in Fig. 5.3b for the well-known biomarker pristane
(4,6,10,14-tetramethylpentadecane).
General Note
Mass spectra of regular aliphatic hydrocarbons exhibit a specific and uniform
pattern. Branched moieties at the carbon chain are visible by systematic shifts
in the relative abundances.
Following the approach of mass spectra interpretation by patterns, a distinct
difference can be observed between mass spectrometric properties of aliphatic and
10 20 30 40 50 60 70 80 90 100 110 120 130 140 150 160 170 180 190 200 210 220
29
43
57
71
85
99
113
212
y
t
i
s
n
e
t
n
i
e
v
i
t
a
l
e
r
m/z
41
29
55
69
83
97
111
210
m/z
y
t
i
s
n
e
t
n
i
e
v
i
t
a
l
e
r
10 20 30 40 50 60 70 80 90 100 110 120 130 140 150 160 170 180 190 200 210 220
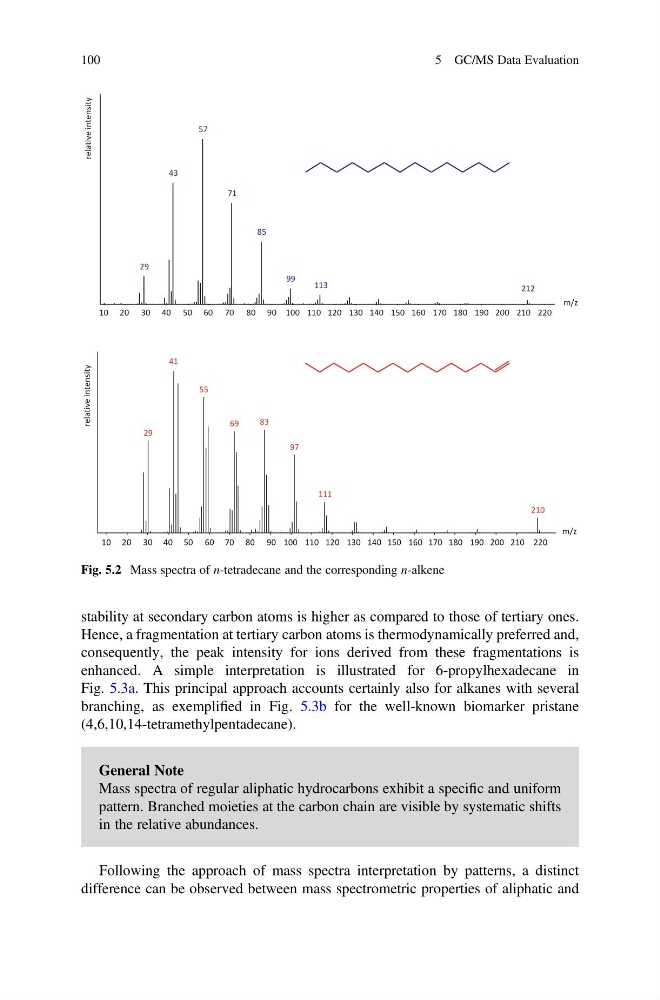
Fig. 5.2 Mass spectra of n-tetradecane and the corresponding n-alkene
100
5 GC/MS Data Evaluation
Hence, a fragmentation at tertiary carbon atoms is thermodynamically preferred and,
consequently, the peak intensity for ions derived from these fragmentations is
enhanced. A simple interpretation is illustrated for 6-propylhexadecane in
Fig. 5.3a. This principal approach accounts certainly also for alkanes with several
branching, as exemplified in Fig. 5.3b for the well-known biomarker pristane
(4,6,10,14-tetramethylpentadecane).
General Note
Mass spectra of regular aliphatic hydrocarbons exhibit a specific and uniform
pattern. Branched moieties at the carbon chain are visible by systematic shifts
in the relative abundances.
Following the approach of mass spectra interpretation by patterns, a distinct
difference can be observed between mass spectrometric properties of aliphatic and
10 20 30 40 50 60 70 80 90 100 110 120 130 140 150 160 170 180 190 200 210 220
29
43
57
71
85
99
113
212
y
t
i
s
n
e
t
n
i
e
v
i
t
a
l
e
r
m/z
41
29
55
69
83
97
111
210
m/z
y
t
i
s
n
e
t
n
i
e
v
i
t
a
l
e
r
10 20 30 40 50 60 70 80 90 100 110 120 130 140 150 160 170 180 190 200 210 220
Fig. 5.2 Mass spectra of n-tetradecane and the corresponding n-alkene
100
5 GC/MS Data Evaluation