

13 Some Frontier Technologies for Aptamers in Medical Applications
381
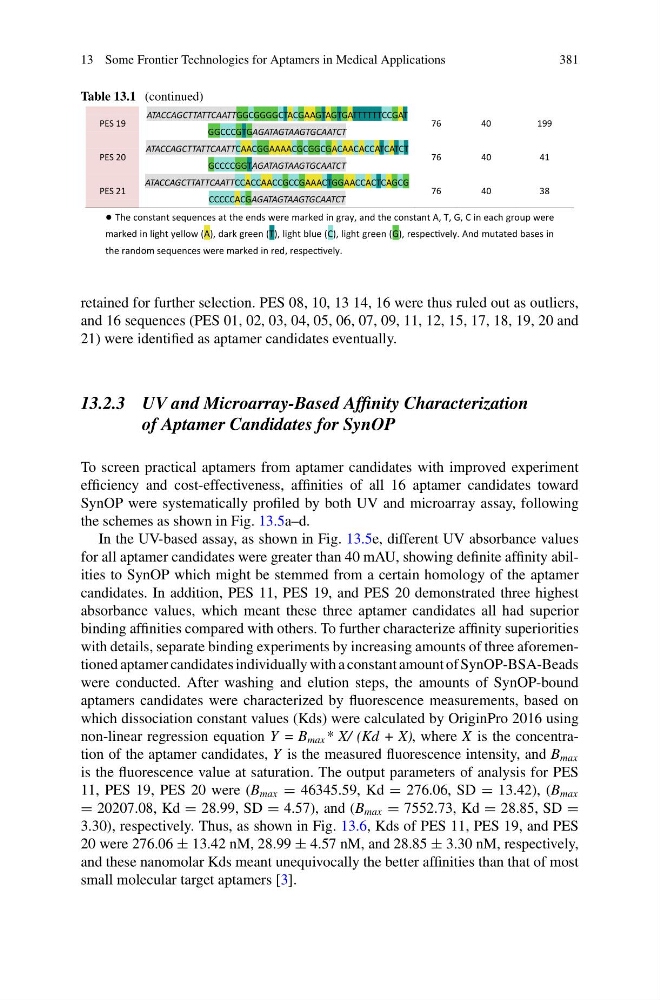
Table 13.1 (continued)
PES 19
ATACCAGCTTATTCAATTGGCGGGGCTACGAAGTAGTGATTTTTTCCGAT
GGCCCGTGAGATAGTAAGTGCAATCT
76
40
199
PES 20
ATACCAGCTTATTCAATTCAACGGAAAACGCGGCGACAACACCATCATCT
GCCCCGGTAGATAGTAAGTGCAATCT
76
40
41
PES 21
ATACCAGCTTATTCAATTCCACCAACCGCCGAAACTGGAACCACTCAGCG
CCCCCACGAGATAGTAAGTGCAATCT
76
40
38
The constant sequences at the ends were marked in gray, and the constant A, T, G, C in each group were
marked in light yellow (A), dark green (T), light blue (C), light green (G), respecƟvely. And mutated bases in
the random sequences were marked in red, respecƟvely.
retained for further selection. PES 08, 10, 13 14, 16 were thus ruled out as outliers,
and 16 sequences (PES 01, 02, 03, 04, 05, 06, 07, 09, 11, 12, 15, 17, 18, 19, 20 and
21) were identified as aptamer candidates eventually.
13.2.3 UV and Microarray-Based Affinity Characterization
of Aptamer Candidates for SynOP
To screen practical aptamers from aptamer candidates with improved experiment
efficiency and cost-effectiveness, affinities of all 16 aptamer candidates toward
SynOP were systematically profiled by both UV and microarray assay, following
the schemes as shown in Fig. 13.5a–d.
In the UV-based assay, as shown in Fig. 13.5e, different UV absorbance values
for all aptamer candidates were greater than 40 mAU, showing definite affinity abilities to SynOP which might be stemmed from a certain homology of the aptamer
candidates. In addition, PES 11, PES 19, and PES 20 demonstrated three highest
absorbance values, which meant these three aptamer candidates all had superior
binding affinities compared with others. To further characterize affinity superiorities
with details, separate binding experiments by increasing amounts of three aforementioned aptamer candidates individually with a constant amount of SynOP-BSA-Beads
were conducted. After washing and elution steps, the amounts of SynOP-bound
aptamers candidates were characterized by fluorescence measurements, based on
which dissociation constant values (Kds) were calculated by OriginPro 2016 using
non-linear regression equation Y = B max * X/ (Kd + X), where X is the concentration of the aptamer candidates, Y is the measured fluorescence intensity, and B max
is the fluorescence value at saturation. The output parameters of analysis for PES
11, PES 19, PES 20 were (B max = 46345.59, Kd = 276.06, SD = 13.42), (B max
= 20207.08, Kd = 28.99, SD = 4.57), and (B max = 7552.73, Kd = 28.85, SD =
3.30), respectively. Thus, as shown in Fig. 13.6, Kds of PES 11, PES 19, and PES
20 were 276.06 ± 13.42 nM, 28.99 ± 4.57 nM, and 28.85 ± 3.30 nM, respectively,
and these nanomolar Kds meant unequivocally the better affinities than that of most
small molecular target aptamers [3].
381
Table 13.1 (continued)
PES 19
ATACCAGCTTATTCAATTGGCGGGGCTACGAAGTAGTGATTTTTTCCGAT
GGCCCGTGAGATAGTAAGTGCAATCT
76
40
199
PES 20
ATACCAGCTTATTCAATTCAACGGAAAACGCGGCGACAACACCATCATCT
GCCCCGGTAGATAGTAAGTGCAATCT
76
40
41
PES 21
ATACCAGCTTATTCAATTCCACCAACCGCCGAAACTGGAACCACTCAGCG
CCCCCACGAGATAGTAAGTGCAATCT
76
40
38
The constant sequences at the ends were marked in gray, and the constant A, T, G, C in each group were
marked in light yellow (A), dark green (T), light blue (C), light green (G), respecƟvely. And mutated bases in
the random sequences were marked in red, respecƟvely.
retained for further selection. PES 08, 10, 13 14, 16 were thus ruled out as outliers,
and 16 sequences (PES 01, 02, 03, 04, 05, 06, 07, 09, 11, 12, 15, 17, 18, 19, 20 and
21) were identified as aptamer candidates eventually.
13.2.3 UV and Microarray-Based Affinity Characterization
of Aptamer Candidates for SynOP
To screen practical aptamers from aptamer candidates with improved experiment
efficiency and cost-effectiveness, affinities of all 16 aptamer candidates toward
SynOP were systematically profiled by both UV and microarray assay, following
the schemes as shown in Fig. 13.5a–d.
In the UV-based assay, as shown in Fig. 13.5e, different UV absorbance values
for all aptamer candidates were greater than 40 mAU, showing definite affinity abilities to SynOP which might be stemmed from a certain homology of the aptamer
candidates. In addition, PES 11, PES 19, and PES 20 demonstrated three highest
absorbance values, which meant these three aptamer candidates all had superior
binding affinities compared with others. To further characterize affinity superiorities
with details, separate binding experiments by increasing amounts of three aforementioned aptamer candidates individually with a constant amount of SynOP-BSA-Beads
were conducted. After washing and elution steps, the amounts of SynOP-bound
aptamers candidates were characterized by fluorescence measurements, based on
which dissociation constant values (Kds) were calculated by OriginPro 2016 using
non-linear regression equation Y = B max * X/ (Kd + X), where X is the concentration of the aptamer candidates, Y is the measured fluorescence intensity, and B max
is the fluorescence value at saturation. The output parameters of analysis for PES
11, PES 19, PES 20 were (B max = 46345.59, Kd = 276.06, SD = 13.42), (B max
= 20207.08, Kd = 28.99, SD = 4.57), and (B max = 7552.73, Kd = 28.85, SD =
3.30), respectively. Thus, as shown in Fig. 13.6, Kds of PES 11, PES 19, and PES
20 were 276.06 ± 13.42 nM, 28.99 ± 4.57 nM, and 28.85 ± 3.30 nM, respectively,
and these nanomolar Kds meant unequivocally the better affinities than that of most
small molecular target aptamers [3].