

Biomechanical Characterization of Hook-Climber Stems for Soft Robotic Applications
101
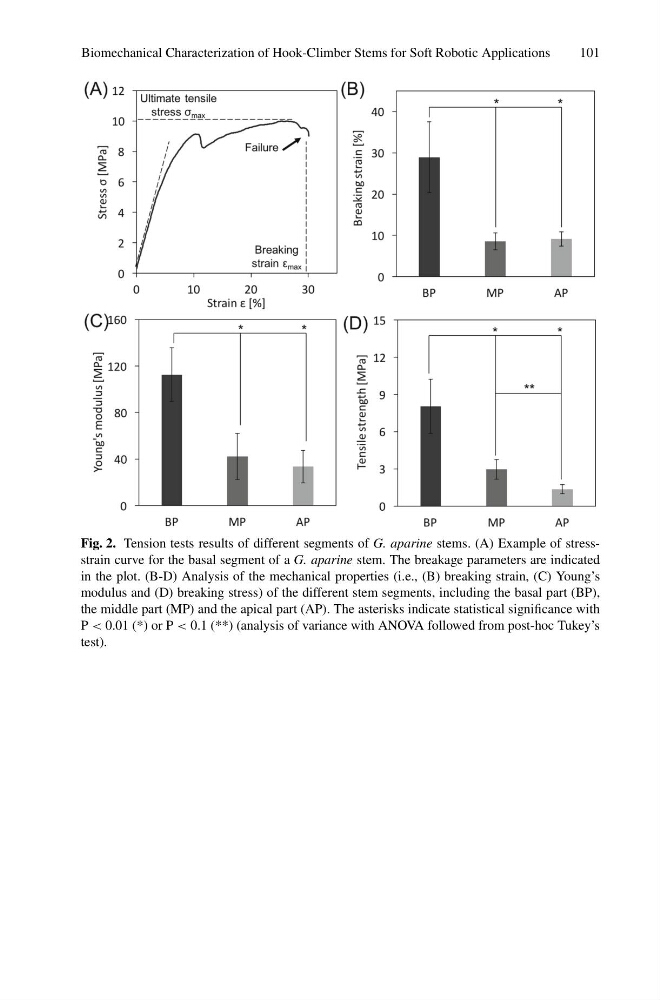
Fig. 2. Tension tests results of different segments of G. aparine stems. (A) Example of stressstrain curve for the basal segment of a G. aparine stem. The breakage parameters are indicated
in the plot. (B-D) Analysis of the mechanical properties (i.e., (B) breaking strain, (C) Young’s
modulus and (D) breaking stress) of the different stem segments, including the basal part (BP),
the middle part (MP) and the apical part (AP). The asterisks indicate statistical significance with
P < 0.01 (*) or P < 0.1 (**) (analysis of variance with ANOVA followed from post-hoc Tukey’s
test).
101
Fig. 2. Tension tests results of different segments of G. aparine stems. (A) Example of stressstrain curve for the basal segment of a G. aparine stem. The breakage parameters are indicated
in the plot. (B-D) Analysis of the mechanical properties (i.e., (B) breaking strain, (C) Young’s
modulus and (D) breaking stress) of the different stem segments, including the basal part (BP),
the middle part (MP) and the apical part (AP). The asterisks indicate statistical significance with
P < 0.01 (*) or P < 0.1 (**) (analysis of variance with ANOVA followed from post-hoc Tukey’s
test).