

Cholinergic Control of Chaos and Evidence Sensitivity in a Neocortical Model
95
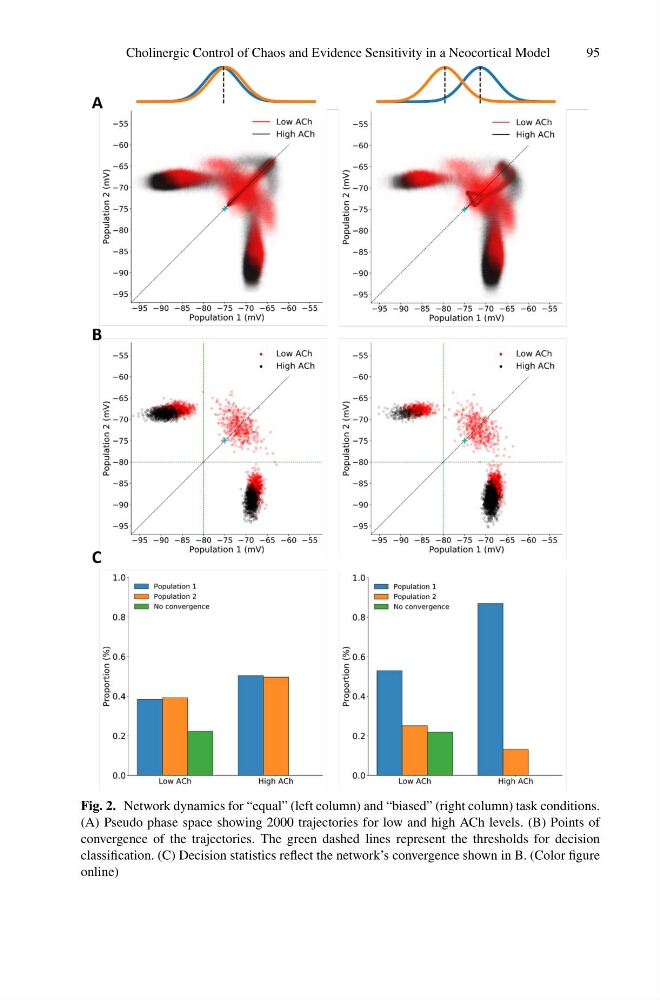
Fig. 2. Network dynamics for “equal” (left column) and “biased” (right column) task conditions.
(A) Pseudo phase space showing 2000 trajectories for low and high ACh levels. (B) Points of
convergence of the trajectories. The green dashed lines represent the thresholds for decision
classification. (C) Decision statistics reflect the network’s convergence shown in B. (Color figure
online)
95
Fig. 2. Network dynamics for “equal” (left column) and “biased” (right column) task conditions.
(A) Pseudo phase space showing 2000 trajectories for low and high ACh levels. (B) Points of
convergence of the trajectories. The green dashed lines represent the thresholds for decision
classification. (C) Decision statistics reflect the network’s convergence shown in B. (Color figure
online)