

b
cytoplasmic spots
average intensity±SD
366±69
nuclear spots
average intensity±SD
776±132
c
A A A A A A (. ..)
a
nucleus
cytoplasm
single mRNA
transcription site
mRNA smFISH filtered
Identified SPOTS
MERGE
nuclear
cytoplasmic
(i)
(ii)
(iii)
0
250
500
750
1000
1250
1500
0
50
100
150
200
0
2
4
6
8
10
Spot intensity (raw value)
# cytoplasmic spots
# nuclear spots
cytoplasm
nucleus
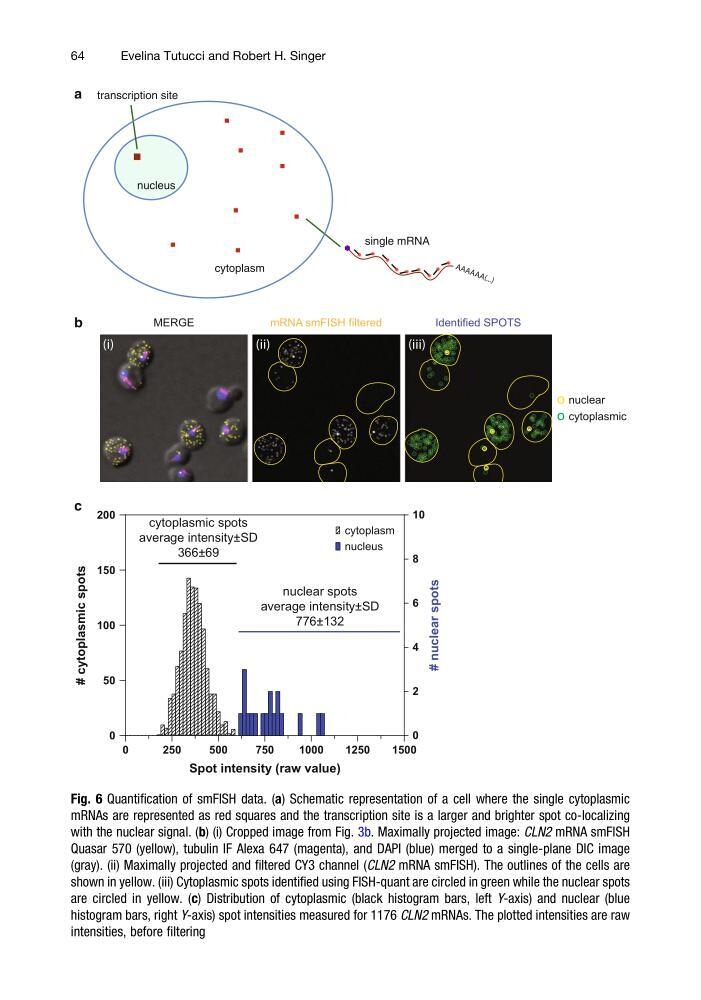
Fig. 6 Quantification of smFISH data. (a) Schematic representation of a cell where the single cytoplasmic
mRNAs are represented as red squares and the transcription site is a larger and brighter spot co-localizing
with the nuclear signal. (b) (i) Cropped image from Fig. 3b. Maximally projected image: CLN2 mRNA smFISH
Quasar 570 (yellow), tubulin IF Alexa 647 (magenta), and DAPI (blue) merged to a single-plane DIC image
(gray). (ii) Maximally projected and filtered CY3 channel (CLN2 mRNA smFISH). The outlines of the cells are
shown in yellow. (iii) Cytoplasmic spots identified using FISH-quant are circled in green while the nuclear spots
are circled in yellow. (c) Distribution of cytoplasmic (black histogram bars, left Y-axis) and nuclear (blue
histogram bars, right Y-axis) spot intensities measured for 1176 CLN2 mRNAs. The plotted intensities are raw
intensities, before filtering
64
Evelina Tutucci and Robert H. Singer
cytoplasmic spots
average intensity±SD
366±69
nuclear spots
average intensity±SD
776±132
c
A A A A A A (. ..)
a
nucleus
cytoplasm
single mRNA
transcription site
mRNA smFISH filtered
Identified SPOTS
MERGE
nuclear
cytoplasmic
(i)
(ii)
(iii)
0
250
500
750
1000
1250
1500
0
50
100
150
200
0
2
4
6
8
10
Spot intensity (raw value)
# cytoplasmic spots
# nuclear spots
cytoplasm
nucleus
Fig. 6 Quantification of smFISH data. (a) Schematic representation of a cell where the single cytoplasmic
mRNAs are represented as red squares and the transcription site is a larger and brighter spot co-localizing
with the nuclear signal. (b) (i) Cropped image from Fig. 3b. Maximally projected image: CLN2 mRNA smFISH
Quasar 570 (yellow), tubulin IF Alexa 647 (magenta), and DAPI (blue) merged to a single-plane DIC image
(gray). (ii) Maximally projected and filtered CY3 channel (CLN2 mRNA smFISH). The outlines of the cells are
shown in yellow. (iii) Cytoplasmic spots identified using FISH-quant are circled in green while the nuclear spots
are circled in yellow. (c) Distribution of cytoplasmic (black histogram bars, left Y-axis) and nuclear (blue
histogram bars, right Y-axis) spot intensities measured for 1176 CLN2 mRNAs. The plotted intensities are raw
intensities, before filtering
64
Evelina Tutucci and Robert H. Singer