

[16, 21]. Combining this technique with smFISH can allow one to
quantitatively assess how various mRNA species associate with the
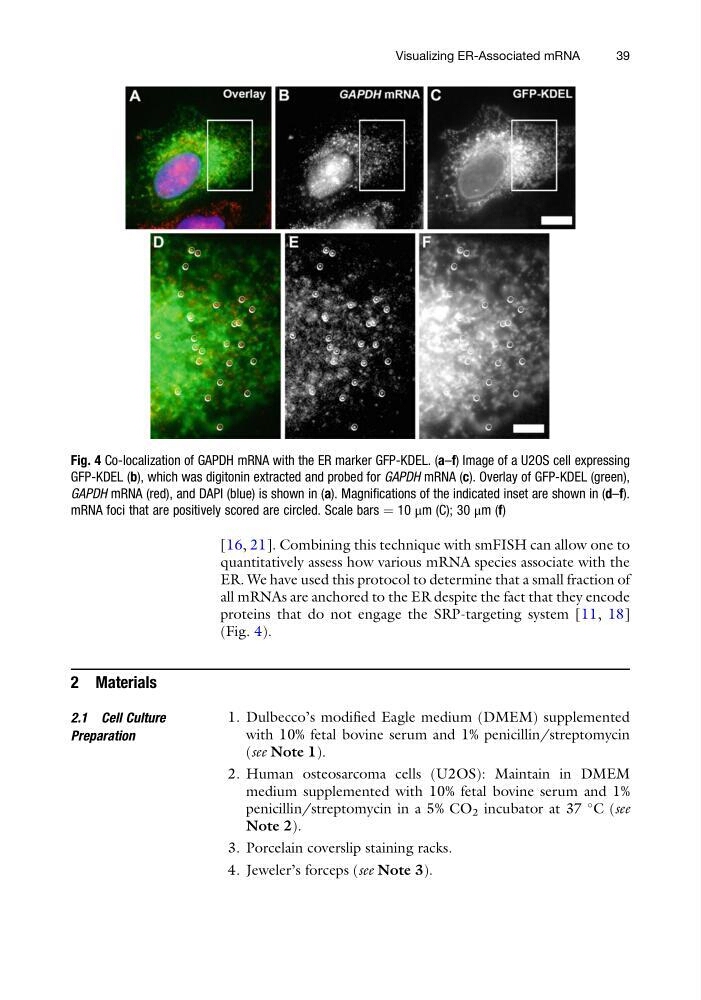
ER. We have used this protocol to determine that a small fraction of
all mRNAs are anchored to the ER despite the fact that they encode
proteins that do not engage the SRP-targeting system [11, 18]
(Fig. 4).
2 Materials
2.1 Cell Culture
Preparation
1. Dulbecco’s modified Eagle medium (DMEM) supplemented
with 10% fetal bovine serum and 1% penicillin/streptomycin
(see Note 1).
2. Human osteosarcoma cells (U2OS): Maintain in DMEM
medium supplemented with 10% fetal bovine serum and 1%
penicillin/streptomycin in a 5% CO 2 incubator at 37
C (see
Note 2).
3. Porcelain coverslip staining racks.
4. Jeweler’s forceps (see Note 3).
Fig. 4 Co-localization of GAPDH mRNA with the ER marker GFP-KDEL. (a–f) Image of a U2OS cell expressing
GFP-KDEL (b), which was digitonin extracted and probed for GAPDH mRNA (c). Overlay of GFP-KDEL (green),
GAPDH mRNA (red), and DAPI (blue) is shown in (a). Magnifications of the indicated inset are shown in (d–f).
mRNA foci that are positively scored are circled. Scale bars ¼ 10 μm (C); 30 μm (f)
Visualizing ER-Associated mRNA
39
quantitatively assess how various mRNA species associate with the
ER. We have used this protocol to determine that a small fraction of
all mRNAs are anchored to the ER despite the fact that they encode
proteins that do not engage the SRP-targeting system [11, 18]
(Fig. 4).
2 Materials
2.1 Cell Culture
Preparation
1. Dulbecco’s modified Eagle medium (DMEM) supplemented
with 10% fetal bovine serum and 1% penicillin/streptomycin
(see Note 1).
2. Human osteosarcoma cells (U2OS): Maintain in DMEM
medium supplemented with 10% fetal bovine serum and 1%
penicillin/streptomycin in a 5% CO 2 incubator at 37
C (see
Note 2).
3. Porcelain coverslip staining racks.
4. Jeweler’s forceps (see Note 3).
Fig. 4 Co-localization of GAPDH mRNA with the ER marker GFP-KDEL. (a–f) Image of a U2OS cell expressing
GFP-KDEL (b), which was digitonin extracted and probed for GAPDH mRNA (c). Overlay of GFP-KDEL (green),
GAPDH mRNA (red), and DAPI (blue) is shown in (a). Magnifications of the indicated inset are shown in (d–f).
mRNA foci that are positively scored are circled. Scale bars ¼ 10 μm (C); 30 μm (f)
Visualizing ER-Associated mRNA
39