

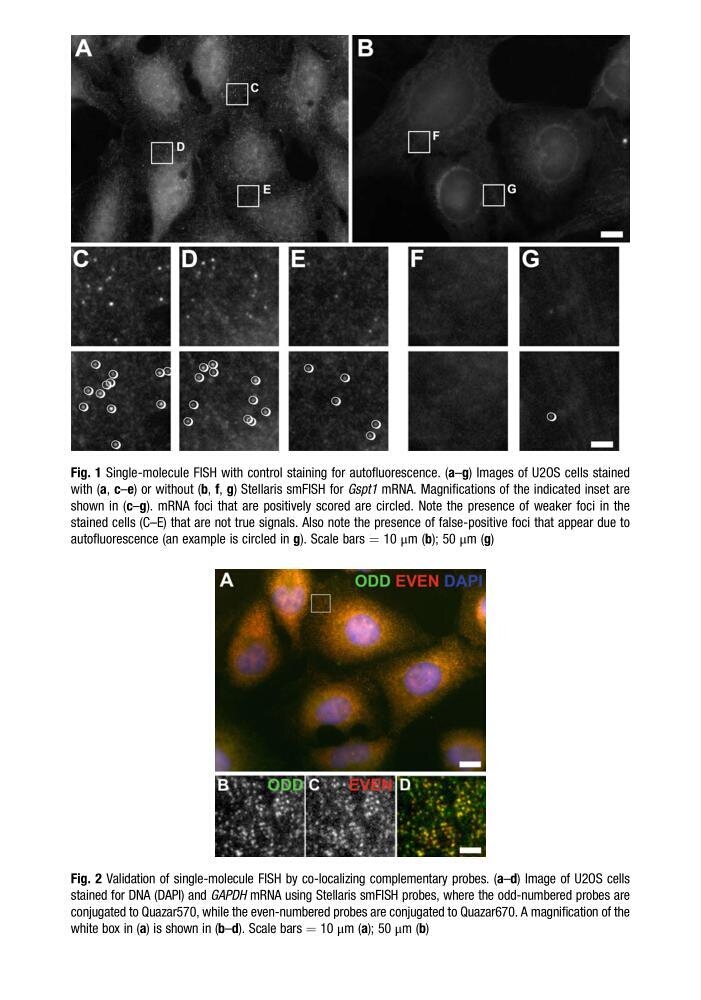
Fig. 1 Single-molecule FISH with control staining for autofluorescence. (a–g) Images of U2OS cells stained
with (a, c–e) or without (b, f, g) Stellaris smFISH for Gspt1 mRNA. Magnifications of the indicated inset are
shown in (c–g). mRNA foci that are positively scored are circled. Note the presence of weaker foci in the
stained cells (C–E) that are not true signals. Also note the presence of false-positive foci that appear due to
autofluorescence (an example is circled in g). Scale bars ¼ 10 μm (b); 50 μm (g)
Fig. 2 Validation of single-molecule FISH by co-localizing complementary probes. (a–d) Image of U2OS cells
stained for DNA (DAPI) and GAPDH mRNA using Stellaris smFISH probes, where the odd-numbered probes are
conjugated to Quazar570, while the even-numbered probes are conjugated to Quazar670. A magnification of the
white box in (a) is shown in (b–d). Scale bars ¼ 10 μm (a); 50 μm (b)
with (a, c–e) or without (b, f, g) Stellaris smFISH for Gspt1 mRNA. Magnifications of the indicated inset are
shown in (c–g). mRNA foci that are positively scored are circled. Note the presence of weaker foci in the
stained cells (C–E) that are not true signals. Also note the presence of false-positive foci that appear due to
autofluorescence (an example is circled in g). Scale bars ¼ 10 μm (b); 50 μm (g)
Fig. 2 Validation of single-molecule FISH by co-localizing complementary probes. (a–d) Image of U2OS cells
stained for DNA (DAPI) and GAPDH mRNA using Stellaris smFISH probes, where the odd-numbered probes are
conjugated to Quazar570, while the even-numbered probes are conjugated to Quazar670. A magnification of the
white box in (a) is shown in (b–d). Scale bars ¼ 10 μm (a); 50 μm (b)