

6. Flip the double-sided tape. Use a dissecting needle to gently
push each embryo from the direction perpendicular to its
anterior-posterior axis, so that chorion sticks to the tape and
breaks to expose the inside of the embryo. Prevent the embryo
vitelline from touching the tape.
enhancers
evePr
parS
PP7
MS2
evePr
3xmKate2
3xtagBFP2
eGFP
PCP
MCP
ParB
142kb
a
b
c
d
e
0 s
15 s
30 s
45 s
60 s
75 s
90 s
105 s
0 s
15 s
30 s
45 s
60 s
75 s
90 s
105 s
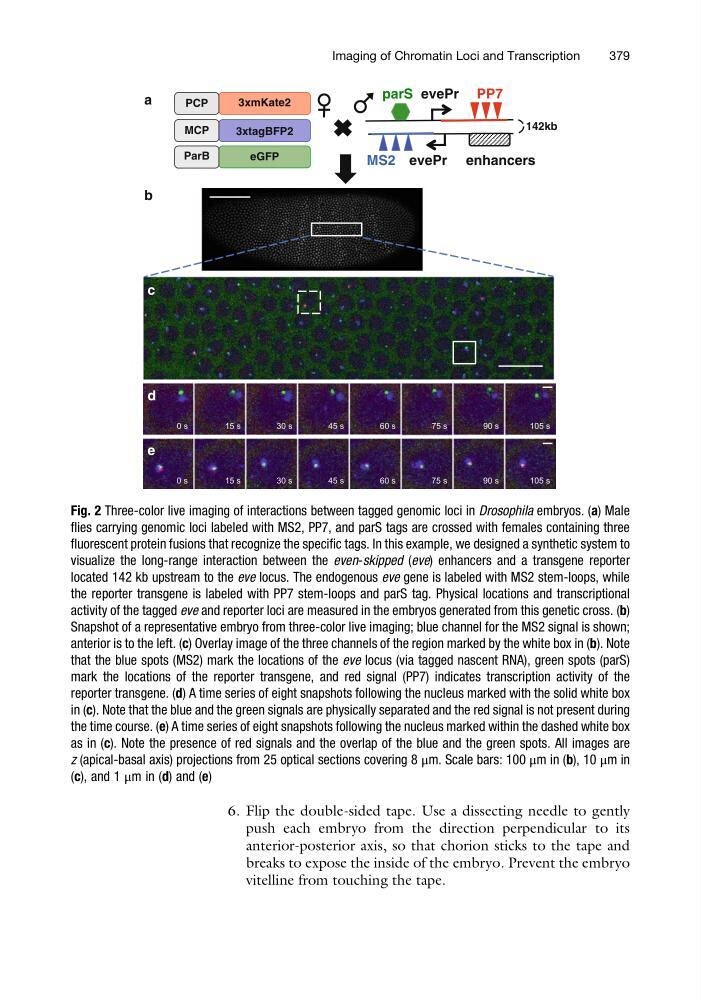
Fig. 2 Three-color live imaging of interactions between tagged genomic loci in Drosophila embryos. (a) Male
flies carrying genomic loci labeled with MS2, PP7, and parS tags are crossed with females containing three
fluorescent protein fusions that recognize the specific tags. In this example, we designed a synthetic system to
visualize the long-range interaction between the even-skipped (eve) enhancers and a transgene reporter
located 142 kb upstream to the eve locus. The endogenous eve gene is labeled with MS2 stem-loops, while
the reporter transgene is labeled with PP7 stem-loops and parS tag. Physical locations and transcriptional
activity of the tagged eve and reporter loci are measured in the embryos generated from this genetic cross. (b)
Snapshot of a representative embryo from three-color live imaging; blue channel for the MS2 signal is shown;
anterior is to the left. (c) Overlay image of the three channels of the region marked by the white box in (b). Note
that the blue spots (MS2) mark the locations of the eve locus (via tagged nascent RNA), green spots (parS)
mark the locations of the reporter transgene, and red signal (PP7) indicates transcription activity of the
reporter transgene. (d) A time series of eight snapshots following the nucleus marked with the solid white box
in (c). Note that the blue and the green signals are physically separated and the red signal is not present during
the time course. (e) A time series of eight snapshots following the nucleus marked within the dashed white box
as in (c). Note the presence of red signals and the overlap of the blue and the green spots. All images are
z (apical-basal axis) projections from 25 optical sections covering 8 μm. Scale bars: 100 μm in (b), 10 μm in
(c), and 1 μm in (d) and (e)
Imaging of Chromatin Loci and Transcription
379
push each embryo from the direction perpendicular to its
anterior-posterior axis, so that chorion sticks to the tape and
breaks to expose the inside of the embryo. Prevent the embryo
vitelline from touching the tape.
enhancers
evePr
parS
PP7
MS2
evePr
3xmKate2
3xtagBFP2
eGFP
PCP
MCP
ParB
142kb
a
b
c
d
e
0 s
15 s
30 s
45 s
60 s
75 s
90 s
105 s
0 s
15 s
30 s
45 s
60 s
75 s
90 s
105 s
Fig. 2 Three-color live imaging of interactions between tagged genomic loci in Drosophila embryos. (a) Male
flies carrying genomic loci labeled with MS2, PP7, and parS tags are crossed with females containing three
fluorescent protein fusions that recognize the specific tags. In this example, we designed a synthetic system to
visualize the long-range interaction between the even-skipped (eve) enhancers and a transgene reporter
located 142 kb upstream to the eve locus. The endogenous eve gene is labeled with MS2 stem-loops, while
the reporter transgene is labeled with PP7 stem-loops and parS tag. Physical locations and transcriptional
activity of the tagged eve and reporter loci are measured in the embryos generated from this genetic cross. (b)
Snapshot of a representative embryo from three-color live imaging; blue channel for the MS2 signal is shown;
anterior is to the left. (c) Overlay image of the three channels of the region marked by the white box in (b). Note
that the blue spots (MS2) mark the locations of the eve locus (via tagged nascent RNA), green spots (parS)
mark the locations of the reporter transgene, and red signal (PP7) indicates transcription activity of the
reporter transgene. (d) A time series of eight snapshots following the nucleus marked with the solid white box
in (c). Note that the blue and the green signals are physically separated and the red signal is not present during
the time course. (e) A time series of eight snapshots following the nucleus marked within the dashed white box
as in (c). Note the presence of red signals and the overlap of the blue and the green spots. All images are
z (apical-basal axis) projections from 25 optical sections covering 8 μm. Scale bars: 100 μm in (b), 10 μm in
(c), and 1 μm in (d) and (e)
Imaging of Chromatin Loci and Transcription
379