

15. Save Spots in Track Statistics in the “.txt” format for further
MSD analysis. Import the assigned tracks into @msdanalyzer
written in MATLAB (see Note 27). Results for MSD analysis of
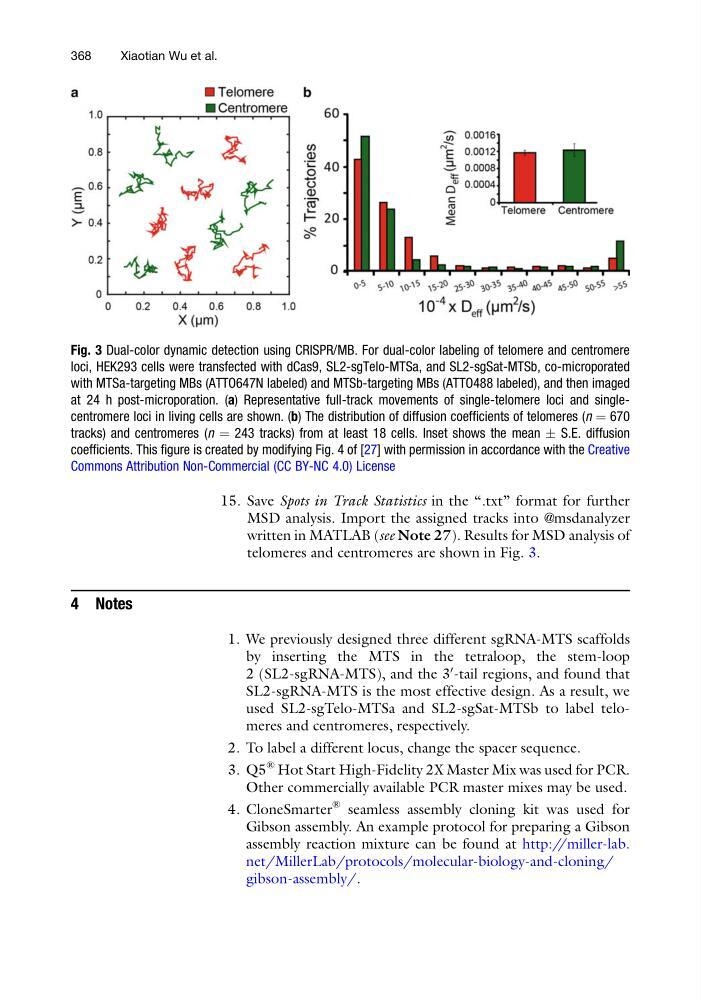
telomeres and centromeres are shown in Fig. 3.
4 Notes
1. We previously designed three different sgRNA-MTS scaffolds
by inserting the MTS in the tetraloop, the stem-loop
2 (SL2-sgRNA-MTS), and the 3
0 -tail regions, and found that
SL2-sgRNA-MTS is the most effective design. As a result, we
used SL2-sgTelo-MTSa and SL2-sgSat-MTSb to label telomeres and centromeres, respectively.
2. To label a different locus, change the spacer sequence.
3. Q5
® Hot Start High-Fidelity 2X Master Mix was used for PCR.
Other commercially available PCR master mixes may be used.
4. CloneSmarter
® seamless assembly cloning kit was used for
Gibson assembly. An example protocol for preparing a Gibson
assembly reaction mixture can be found at http://miller-lab.
net/MillerLab/protocols/molecular-biology-and-cloning/
gibson-assembly/.
Fig. 3 Dual-color dynamic detection using CRISPR/MB. For dual-color labeling of telomere and centromere
loci, HEK293 cells were transfected with dCas9, SL2-sgTelo-MTSa, and SL2-sgSat-MTSb, co-microporated
with MTSa-targeting MBs (ATTO647N labeled) and MTSb-targeting MBs (ATTO488 labeled), and then imaged
at 24 h post-microporation. (a) Representative full-track movements of single-telomere loci and singlecentromere loci in living cells are shown. (b) The distribution of diffusion coefficients of telomeres (n ¼ 670
tracks) and centromeres (n ¼ 243 tracks) from at least 18 cells. Inset shows the mean Æ S.E. diffusion
coefficients. This figure is created by modifying Fig. 4 of [27] with permission in accordance with the Creative
Commons Attribution Non-Commercial (CC BY-NC 4.0) License
368
Xiaotian Wu et al.
MSD analysis. Import the assigned tracks into @msdanalyzer
written in MATLAB (see Note 27). Results for MSD analysis of
telomeres and centromeres are shown in Fig. 3.
4 Notes
1. We previously designed three different sgRNA-MTS scaffolds
by inserting the MTS in the tetraloop, the stem-loop
2 (SL2-sgRNA-MTS), and the 3
0 -tail regions, and found that
SL2-sgRNA-MTS is the most effective design. As a result, we
used SL2-sgTelo-MTSa and SL2-sgSat-MTSb to label telomeres and centromeres, respectively.
2. To label a different locus, change the spacer sequence.
3. Q5
® Hot Start High-Fidelity 2X Master Mix was used for PCR.
Other commercially available PCR master mixes may be used.
4. CloneSmarter
® seamless assembly cloning kit was used for
Gibson assembly. An example protocol for preparing a Gibson
assembly reaction mixture can be found at http://miller-lab.
net/MillerLab/protocols/molecular-biology-and-cloning/
gibson-assembly/.
Fig. 3 Dual-color dynamic detection using CRISPR/MB. For dual-color labeling of telomere and centromere
loci, HEK293 cells were transfected with dCas9, SL2-sgTelo-MTSa, and SL2-sgSat-MTSb, co-microporated
with MTSa-targeting MBs (ATTO647N labeled) and MTSb-targeting MBs (ATTO488 labeled), and then imaged
at 24 h post-microporation. (a) Representative full-track movements of single-telomere loci and singlecentromere loci in living cells are shown. (b) The distribution of diffusion coefficients of telomeres (n ¼ 670
tracks) and centromeres (n ¼ 243 tracks) from at least 18 cells. Inset shows the mean Æ S.E. diffusion
coefficients. This figure is created by modifying Fig. 4 of [27] with permission in accordance with the Creative
Commons Attribution Non-Commercial (CC BY-NC 4.0) License
368
Xiaotian Wu et al.