

general, if a high degree of specificity is desired, it is recommended
to use long, paired-end reads. If the query RNAs are less abundant,
sequencing at a higher level of coverage is preferred. For example,
transferred RNAs in vitro typically represent <2% of the total for a
given species of RNA in MEFs (Fig. 4) [14]. Thus, given the
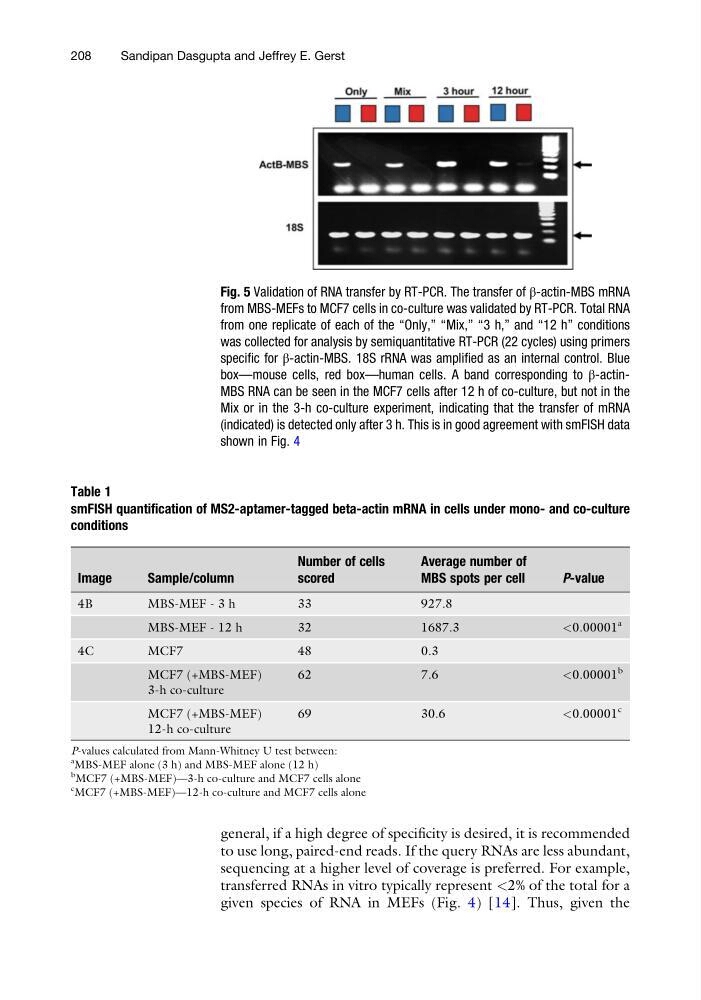
Fig. 5 Validation of RNA transfer by RT-PCR. The transfer of β-actin-MBS mRNA
from MBS-MEFs to MCF7 cells in co-culture was validated by RT-PCR. Total RNA
from one replicate of each of the “Only,” “Mix,” “3 h,” and “12 h” conditions
was collected for analysis by semiquantitative RT-PCR (22 cycles) using primers
specific for β-actin-MBS. 18S rRNA was amplified as an internal control. Blue
box—mouse cells, red box—human cells. A band corresponding to β-actinMBS RNA can be seen in the MCF7 cells after 12 h of co-culture, but not in the
Mix or in the 3-h co-culture experiment, indicating that the transfer of mRNA
(indicated) is detected only after 3 h. This is in good agreement with smFISH data
shown in Fig. 4
Table 1
smFISH quantification of MS2-aptamer-tagged beta-actin mRNA in cells under mono- and co-culture
conditions
Image
Sample/column
Number of cells
scored
Average number of
MBS spots per cell
P-value
4B
MBS-MEF - 3 h
33
927.8
MBS-MEF - 12 h
32
1687.3
<0.00001
a
4C
MCF7
48
0.3
MCF7 (+MBS-MEF)
3-h co-culture
62
7.6
<0.00001
b
MCF7 (+MBS-MEF)
12-h co-culture
69
30.6
<0.00001
c
P-values calculated from Mann-Whitney U test between:
a
MBS-MEF alone (3 h) and MBS-MEF alone (12 h)
b
MCF7 (+MBS-MEF)—3-h co-culture and MCF7 cells alone
c
MCF7 (+MBS-MEF)—12-h co-culture and MCF7 cells alone
208
Sandipan Dasgupta and Jeffrey E. Gerst
to use long, paired-end reads. If the query RNAs are less abundant,
sequencing at a higher level of coverage is preferred. For example,
transferred RNAs in vitro typically represent <2% of the total for a
given species of RNA in MEFs (Fig. 4) [14]. Thus, given the
Fig. 5 Validation of RNA transfer by RT-PCR. The transfer of β-actin-MBS mRNA
from MBS-MEFs to MCF7 cells in co-culture was validated by RT-PCR. Total RNA
from one replicate of each of the “Only,” “Mix,” “3 h,” and “12 h” conditions
was collected for analysis by semiquantitative RT-PCR (22 cycles) using primers
specific for β-actin-MBS. 18S rRNA was amplified as an internal control. Blue
box—mouse cells, red box—human cells. A band corresponding to β-actinMBS RNA can be seen in the MCF7 cells after 12 h of co-culture, but not in the
Mix or in the 3-h co-culture experiment, indicating that the transfer of mRNA
(indicated) is detected only after 3 h. This is in good agreement with smFISH data
shown in Fig. 4
Table 1
smFISH quantification of MS2-aptamer-tagged beta-actin mRNA in cells under mono- and co-culture
conditions
Image
Sample/column
Number of cells
scored
Average number of
MBS spots per cell
P-value
4B
MBS-MEF - 3 h
33
927.8
MBS-MEF - 12 h
32
1687.3
<0.00001
a
4C
MCF7
48
0.3
MCF7 (+MBS-MEF)
3-h co-culture
62
7.6
<0.00001
b
MCF7 (+MBS-MEF)
12-h co-culture
69
30.6
<0.00001
c
P-values calculated from Mann-Whitney U test between:
a
MBS-MEF alone (3 h) and MBS-MEF alone (12 h)
b
MCF7 (+MBS-MEF)—3-h co-culture and MCF7 cells alone
c
MCF7 (+MBS-MEF)—12-h co-culture and MCF7 cells alone
208
Sandipan Dasgupta and Jeffrey E. Gerst