

middle panels), the NLS-MCP-GFPEnvy showed the highest contrast (see signal quantifications in Fig. 5), followed by the NLSMCP-eGFP and NLS-MCP-sfGFP. Single RNA molecules were
only barely detectable with the NLS-MCP-muGFP and NLSMCP-mNG construct, while single RNA molecules were observed
by smFISH (Fig. 3, bottom panels).
In light of these recent developments, we describe here protocols to visualize and quantify mRNAs labeled with the low-affinity
MS2 systems that we recently developed both for S. cerevisiae and
mammalian cells. By describing the visualization of mRNA in these
model organisms, we highlight the general rules and recommendations that can improve live imaging of single mRNAs. While elsewhere we described in depth the steps required to endogenously
tag an mRNA with the MS2 reporter in yeast [43, 58] or in
mammalian cells [49], here we focused on the protocols used to
perform live imaging and to quantify the number and the brightness of single mRNAs and transcription sites.
5’LTR
3’LTR
SA7
SD1
PolyA
RRE
HIV-1 Promoter
64xMS2: 1.4 kb
0.7 kb
1.6 kb
MCP-GFP
INTRON: 2.6 kb
b
G
G
A
G
U
A
C
A
C
C
C
A
U
G
U
A
U U
A
AAU ...
G
A
A
G
C
C
U
U
C
U
C
G
G
A
A
U U
A
A
Array of 32 unique MS2 stem-loops
2x
MS2x64
a
4x
MS2x128
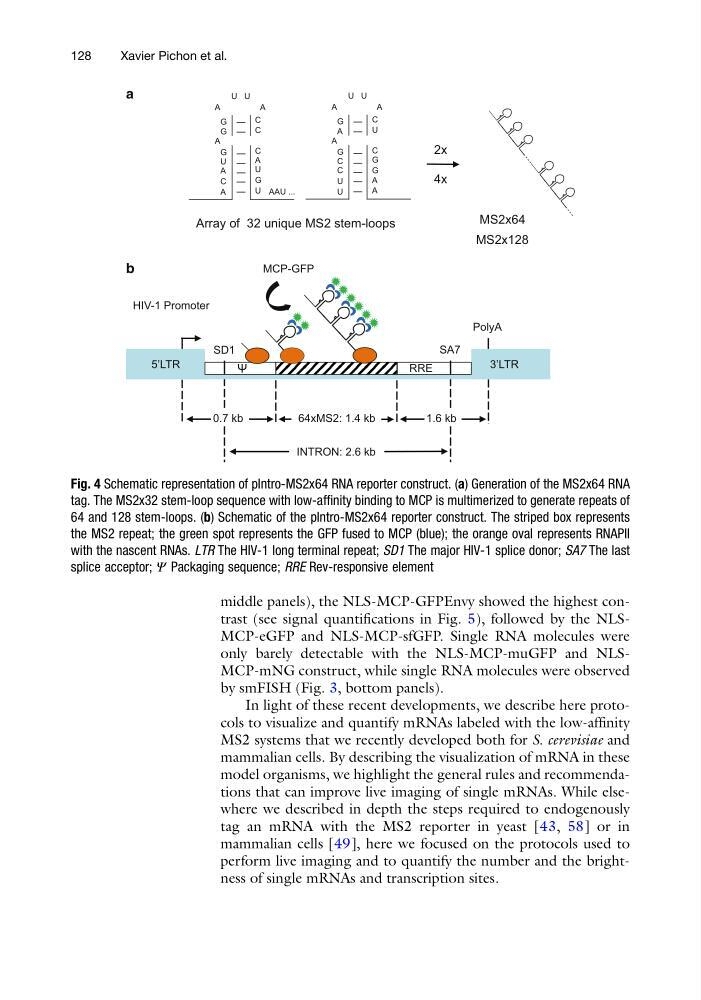
Fig. 4 Schematic representation of pIntro-MS2x64 RNA reporter construct. (a) Generation of the MS2x64 RNA
tag. The MS2x32 stem-loop sequence with low-affinity binding to MCP is multimerized to generate repeats of
64 and 128 stem-loops. (b) Schematic of the pIntro-MS2x64 reporter construct. The striped box represents
the MS2 repeat; the green spot represents the GFP fused to MCP (blue); the orange oval represents RNAPII
with the nascent RNAs. LTR The HIV-1 long terminal repeat; SD1 The major HIV-1 splice donor; SA7 The last
splice acceptor; Ψ Packaging sequence; RRE Rev-responsive element
128
Xavier Pichon et al.
only barely detectable with the NLS-MCP-muGFP and NLSMCP-mNG construct, while single RNA molecules were observed
by smFISH (Fig. 3, bottom panels).
In light of these recent developments, we describe here protocols to visualize and quantify mRNAs labeled with the low-affinity
MS2 systems that we recently developed both for S. cerevisiae and
mammalian cells. By describing the visualization of mRNA in these
model organisms, we highlight the general rules and recommendations that can improve live imaging of single mRNAs. While elsewhere we described in depth the steps required to endogenously
tag an mRNA with the MS2 reporter in yeast [43, 58] or in
mammalian cells [49], here we focused on the protocols used to
perform live imaging and to quantify the number and the brightness of single mRNAs and transcription sites.
5’LTR
3’LTR
SA7
SD1
PolyA
RRE
HIV-1 Promoter
64xMS2: 1.4 kb
0.7 kb
1.6 kb
MCP-GFP
INTRON: 2.6 kb
b
G
G
A
G
U
A
C
A
C
C
C
A
U
G
U
A
U U
A
AAU ...
G
A
A
G
C
C
U
U
C
U
C
G
G
A
A
U U
A
A
Array of 32 unique MS2 stem-loops
2x
MS2x64
a
4x
MS2x128
Fig. 4 Schematic representation of pIntro-MS2x64 RNA reporter construct. (a) Generation of the MS2x64 RNA
tag. The MS2x32 stem-loop sequence with low-affinity binding to MCP is multimerized to generate repeats of
64 and 128 stem-loops. (b) Schematic of the pIntro-MS2x64 reporter construct. The striped box represents
the MS2 repeat; the green spot represents the GFP fused to MCP (blue); the orange oval represents RNAPII
with the nascent RNAs. LTR The HIV-1 long terminal repeat; SD1 The major HIV-1 splice donor; SA7 The last
splice acceptor; Ψ Packaging sequence; RRE Rev-responsive element
128
Xavier Pichon et al.