

b
d
f
a
c
e
5’UTR
MDN1 mRNA
CDS (14Kb)
3’UTR
24xMBSV6
5’UTR
MDN1 mRNA
CDS (14Kb)
3’UTR
24xMBSV6
5’UTR
MDN1 mRNA
CDS (14Kb) 3’UTR
g
1 0 0 0 0 0
2 0 0 0 0 0
3 0 0 0 0 0
4 0 0 0 0 0
5 0 0 0 0 0
6 0 0 0 0 0
7 0 0 0 0 0
8 0 0 0 0 0
9 0 0 0 0 0
1 0 0 0 0 0 0
1 1 0 0 0 0 0
0
10
20
30
Distribution intensities
Spot intensity (a.u.)
%ofm RNAs
MCP-2xyeGFP
MCP-3xyeGFP
MDN1 mRNAs/cell
smFISH
live imaging
0
10
20
30
40
#m RNA/cell
MCP
2xyeGFP
MCP
3xyeGFP
MDN1
endogenous
h
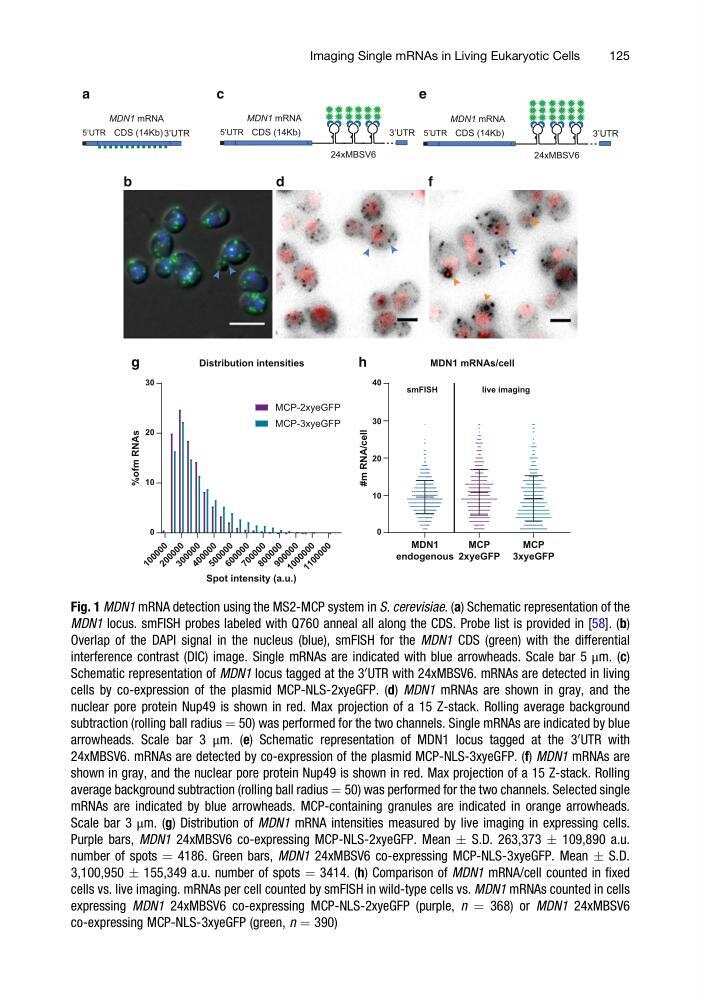
Fig. 1 MDN1 mRNA detection using the MS2-MCP system in S. cerevisiae. (a) Schematic representation of the
MDN1 locus. smFISH probes labeled with Q760 anneal all along the CDS. Probe list is provided in [58]. (b)
Overlap of the DAPI signal in the nucleus (blue), smFISH for the MDN1 CDS (green) with the differential
interference contrast (DIC) image. Single mRNAs are indicated with blue arrowheads. Scale bar 5 μm. (c)
Schematic representation of MDN1 locus tagged at the 3
0 UTR with 24xMBSV6. mRNAs are detected in living
cells by co-expression of the plasmid MCP-NLS-2xyeGFP. (d) MDN1 mRNAs are shown in gray, and the
nuclear pore protein Nup49 is shown in red. Max projection of a 15 Z-stack. Rolling average background
subtraction (rolling ball radius ¼ 50) was performed for the two channels. Single mRNAs are indicated by blue
arrowheads. Scale bar 3 μm. (e) Schematic representation of MDN1 locus tagged at the 3
0 UTR with
24xMBSV6. mRNAs are detected by co-expression of the plasmid MCP-NLS-3xyeGFP. (f) MDN1 mRNAs are
shown in gray, and the nuclear pore protein Nup49 is shown in red. Max projection of a 15 Z-stack. Rolling
average background subtraction (rolling ball radius ¼ 50) was performed for the two channels. Selected single
mRNAs are indicated by blue arrowheads. MCP-containing granules are indicated in orange arrowheads.
Scale bar 3 μm. (g) Distribution of MDN1 mRNA intensities measured by live imaging in expressing cells.
Purple bars, MDN1 24xMBSV6 co-expressing MCP-NLS-2xyeGFP. Mean Æ S.D. 263,373 Æ 109,890 a.u.
number of spots ¼ 4186. Green bars, MDN1 24xMBSV6 co-expressing MCP-NLS-3xyeGFP. Mean Æ S.D.
3,100,950 Æ 155,349 a.u. number of spots ¼ 3414. (h) Comparison of MDN1 mRNA/cell counted in fixed
cells vs. live imaging. mRNAs per cell counted by smFISH in wild-type cells vs. MDN1 mRNAs counted in cells
expressing MDN1 24xMBSV6 co-expressing MCP-NLS-2xyeGFP (purple, n ¼ 368) or MDN1 24xMBSV6
co-expressing MCP-NLS-3xyeGFP (green, n ¼ 390)
Imaging Single mRNAs in Living Eukaryotic Cells
125
d
f
a
c
e
5’UTR
MDN1 mRNA
CDS (14Kb)
3’UTR
24xMBSV6
5’UTR
MDN1 mRNA
CDS (14Kb)
3’UTR
24xMBSV6
5’UTR
MDN1 mRNA
CDS (14Kb) 3’UTR
g
1 0 0 0 0 0
2 0 0 0 0 0
3 0 0 0 0 0
4 0 0 0 0 0
5 0 0 0 0 0
6 0 0 0 0 0
7 0 0 0 0 0
8 0 0 0 0 0
9 0 0 0 0 0
1 0 0 0 0 0 0
1 1 0 0 0 0 0
0
10
20
30
Distribution intensities
Spot intensity (a.u.)
%ofm RNAs
MCP-2xyeGFP
MCP-3xyeGFP
MDN1 mRNAs/cell
smFISH
live imaging
0
10
20
30
40
#m RNA/cell
MCP
2xyeGFP
MCP
3xyeGFP
MDN1
endogenous
h
Fig. 1 MDN1 mRNA detection using the MS2-MCP system in S. cerevisiae. (a) Schematic representation of the
MDN1 locus. smFISH probes labeled with Q760 anneal all along the CDS. Probe list is provided in [58]. (b)
Overlap of the DAPI signal in the nucleus (blue), smFISH for the MDN1 CDS (green) with the differential
interference contrast (DIC) image. Single mRNAs are indicated with blue arrowheads. Scale bar 5 μm. (c)
Schematic representation of MDN1 locus tagged at the 3
0 UTR with 24xMBSV6. mRNAs are detected in living
cells by co-expression of the plasmid MCP-NLS-2xyeGFP. (d) MDN1 mRNAs are shown in gray, and the
nuclear pore protein Nup49 is shown in red. Max projection of a 15 Z-stack. Rolling average background
subtraction (rolling ball radius ¼ 50) was performed for the two channels. Single mRNAs are indicated by blue
arrowheads. Scale bar 3 μm. (e) Schematic representation of MDN1 locus tagged at the 3
0 UTR with
24xMBSV6. mRNAs are detected by co-expression of the plasmid MCP-NLS-3xyeGFP. (f) MDN1 mRNAs are
shown in gray, and the nuclear pore protein Nup49 is shown in red. Max projection of a 15 Z-stack. Rolling
average background subtraction (rolling ball radius ¼ 50) was performed for the two channels. Selected single
mRNAs are indicated by blue arrowheads. MCP-containing granules are indicated in orange arrowheads.
Scale bar 3 μm. (g) Distribution of MDN1 mRNA intensities measured by live imaging in expressing cells.
Purple bars, MDN1 24xMBSV6 co-expressing MCP-NLS-2xyeGFP. Mean Æ S.D. 263,373 Æ 109,890 a.u.
number of spots ¼ 4186. Green bars, MDN1 24xMBSV6 co-expressing MCP-NLS-3xyeGFP. Mean Æ S.D.
3,100,950 Æ 155,349 a.u. number of spots ¼ 3414. (h) Comparison of MDN1 mRNA/cell counted in fixed
cells vs. live imaging. mRNAs per cell counted by smFISH in wild-type cells vs. MDN1 mRNAs counted in cells
expressing MDN1 24xMBSV6 co-expressing MCP-NLS-2xyeGFP (purple, n ¼ 368) or MDN1 24xMBSV6
co-expressing MCP-NLS-3xyeGFP (green, n ¼ 390)
Imaging Single mRNAs in Living Eukaryotic Cells
125