

8 Super-Resolution Imaging in Raman Microscopy
197
niques, light from a laser source is focused onto a sample by using an objective lens.
The Raman effect induced by the laser light is detected in different ways depending
on the process of signal generation, such as spontaneous Raman scattering, coherent
anti-Stokes Raman scattering (CARS), and stimulated Raman scattering (SRS). The
spatial resolution is theoretically determined by two factors. One of the factors is the
area of Raman effect induced in the sample, and the other is the imaging property of
detection optics. In addition, the imaging property depends on whether the Raman
effect is induced in incoherent or coherent processes and how the Raman effect is
detected. In this section, we mainly discuss the size of the area where the Raman
effect is induced in the sample, since, in the techniques proposed so far, the imaging
property of the detection optical has a smaller contribution in the spatial resolution
than that of the excitation laser spot for Raman excitation.
In the following parts of this section, we describe several techniques that improve
the spatial resolution in Raman microscopy by reducing the area of Raman effect.
The techniques can be further categorized into nonlinear or linear techniques.
8.2.1 Nonlinear Techniques
In CARS and SRS microscopy, the Raman effect is induced by products of laser
intensities of pump and Stokes beams [11–14]. The signal is proportional to I p I p I s
and I p I s for CARS and SRS microscopy, where I p and I s are the intensities of pump
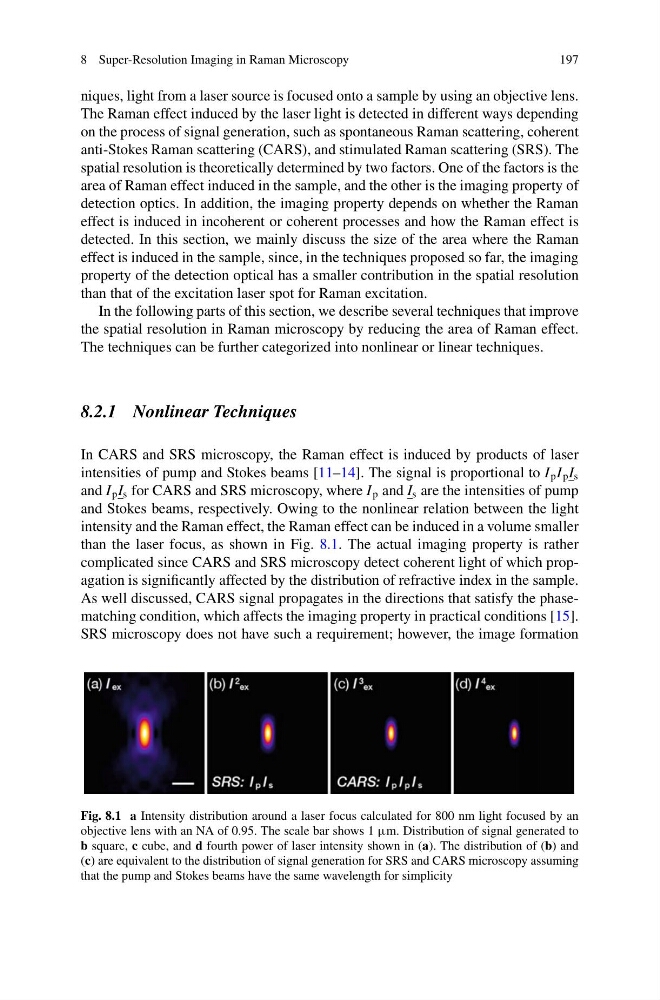
and Stokes beams, respectively. Owing to the nonlinear relation between the light
intensity and the Raman effect, the Raman effect can be induced in a volume smaller
than the laser focus, as shown in Fig. 8.1. The actual imaging property is rather
complicated since CARS and SRS microscopy detect coherent light of which propagation is significantly affected by the distribution of refractive index in the sample.
As well discussed, CARS signal propagates in the directions that satisfy the phasematching condition, which affects the imaging property in practical conditions [15].
SRS microscopy does not have such a requirement; however, the image formation
Fig. 8.1 a Intensity distribution around a laser focus calculated for 800 nm light focused by an
objective lens with an NA of 0.95. The scale bar shows 1 μm. Distribution of signal generated to
b square, c cube, and d fourth power of laser intensity shown in (a). The distribution of (b) and
(c) are equivalent to the distribution of signal generation for SRS and CARS microscopy assuming
that the pump and Stokes beams have the same wavelength for simplicity
197
niques, light from a laser source is focused onto a sample by using an objective lens.
The Raman effect induced by the laser light is detected in different ways depending
on the process of signal generation, such as spontaneous Raman scattering, coherent
anti-Stokes Raman scattering (CARS), and stimulated Raman scattering (SRS). The
spatial resolution is theoretically determined by two factors. One of the factors is the
area of Raman effect induced in the sample, and the other is the imaging property of
detection optics. In addition, the imaging property depends on whether the Raman
effect is induced in incoherent or coherent processes and how the Raman effect is
detected. In this section, we mainly discuss the size of the area where the Raman
effect is induced in the sample, since, in the techniques proposed so far, the imaging
property of the detection optical has a smaller contribution in the spatial resolution
than that of the excitation laser spot for Raman excitation.
In the following parts of this section, we describe several techniques that improve
the spatial resolution in Raman microscopy by reducing the area of Raman effect.
The techniques can be further categorized into nonlinear or linear techniques.
8.2.1 Nonlinear Techniques
In CARS and SRS microscopy, the Raman effect is induced by products of laser
intensities of pump and Stokes beams [11–14]. The signal is proportional to I p I p I s
and I p I s for CARS and SRS microscopy, where I p and I s are the intensities of pump
and Stokes beams, respectively. Owing to the nonlinear relation between the light
intensity and the Raman effect, the Raman effect can be induced in a volume smaller
than the laser focus, as shown in Fig. 8.1. The actual imaging property is rather
complicated since CARS and SRS microscopy detect coherent light of which propagation is significantly affected by the distribution of refractive index in the sample.
As well discussed, CARS signal propagates in the directions that satisfy the phasematching condition, which affects the imaging property in practical conditions [15].
SRS microscopy does not have such a requirement; however, the image formation
Fig. 8.1 a Intensity distribution around a laser focus calculated for 800 nm light focused by an
objective lens with an NA of 0.95. The scale bar shows 1 μm. Distribution of signal generated to
b square, c cube, and d fourth power of laser intensity shown in (a). The distribution of (b) and
(c) are equivalent to the distribution of signal generation for SRS and CARS microscopy assuming
that the pump and Stokes beams have the same wavelength for simplicity