

9 Modelling of Cerebrospinal Fluid Flow by Computational Fluid Dynamics
231
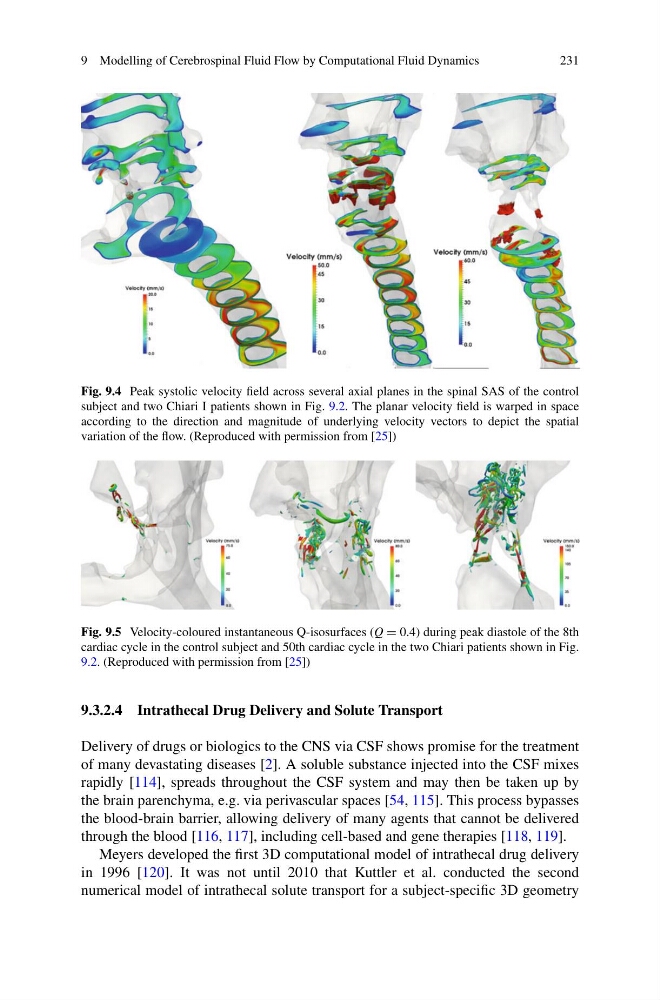
Fig. 9.4 Peak systolic velocity field across several axial planes in the spinal SAS of the control
subject and two Chiari I patients shown in Fig. 9.2. The planar velocity field is warped in space
according to the direction and magnitude of underlying velocity vectors to depict the spatial
variation of the flow. (Reproduced with permission from [25])
Fig. 9.5 Velocity-coloured instantaneous Q-isosurfaces (Q = 0.4) during peak diastole of the 8th
cardiac cycle in the control subject and 50th cardiac cycle in the two Chiari patients shown in Fig.
9.2. (Reproduced with permission from [25])
9.3.2.4 Intrathecal Drug Delivery and Solute Transport
Delivery of drugs or biologics to the CNS via CSF shows promise for the treatment
of many devastating diseases [2]. A soluble substance injected into the CSF mixes
rapidly [114], spreads throughout the CSF system and may then be taken up by
the brain parenchyma, e.g. via perivascular spaces [54, 115]. This process bypasses
the blood-brain barrier, allowing delivery of many agents that cannot be delivered
through the blood [116, 117], including cell-based and gene therapies [118, 119].
Meyers developed the first 3D computational model of intrathecal drug delivery
in 1996 [120]. It was not until 2010 that Kuttler et al. conducted the second
numerical model of intrathecal solute transport for a subject-specific 3D geometry
231
Fig. 9.4 Peak systolic velocity field across several axial planes in the spinal SAS of the control
subject and two Chiari I patients shown in Fig. 9.2. The planar velocity field is warped in space
according to the direction and magnitude of underlying velocity vectors to depict the spatial
variation of the flow. (Reproduced with permission from [25])
Fig. 9.5 Velocity-coloured instantaneous Q-isosurfaces (Q = 0.4) during peak diastole of the 8th
cardiac cycle in the control subject and 50th cardiac cycle in the two Chiari patients shown in Fig.
9.2. (Reproduced with permission from [25])
9.3.2.4 Intrathecal Drug Delivery and Solute Transport
Delivery of drugs or biologics to the CNS via CSF shows promise for the treatment
of many devastating diseases [2]. A soluble substance injected into the CSF mixes
rapidly [114], spreads throughout the CSF system and may then be taken up by
the brain parenchyma, e.g. via perivascular spaces [54, 115]. This process bypasses
the blood-brain barrier, allowing delivery of many agents that cannot be delivered
through the blood [116, 117], including cell-based and gene therapies [118, 119].
Meyers developed the first 3D computational model of intrathecal drug delivery
in 1996 [120]. It was not until 2010 that Kuttler et al. conducted the second
numerical model of intrathecal solute transport for a subject-specific 3D geometry