

56
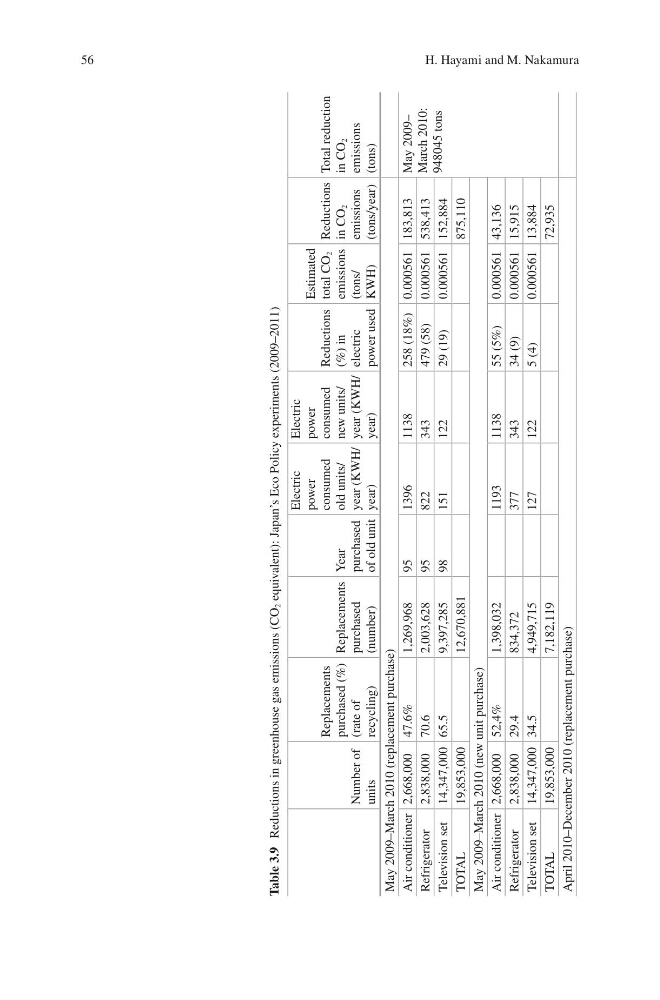
Table 3.9 Reductions in greenhouse gas emissions (CO
2 equivalent): Japan’s Eco Policy experiments (2009–2011)
Number of
units
Replacements
purchased (%)
(rate of
recycling)
Replacements
purchased
(number)
Year
purchased
of old unit
Electric
power
consumed
old units/
year (KWH/
year)
Electric
power
consumed
new units/
year (KWH/
year)
Reductions
(%) in
electric
power used
Estimated
total CO
2
emissions
(tons/
KWH)
Reductions
in CO
2
emissions
(tons/year)
Total reduction
in CO
2
emissions
(tons)
May 2009–March 2010 (replacement purchase)
Air conditioner 2,668,000 47.6%
1,269,968
95
1396
1138
258 (18%) 0.000561 183,813
May 2009–
March 2010:
948045 tons
Refrigerator
2,838,000 70.6
2,003,628
95
822
343
479 (58)
0.000561 538,413
Television set 14,347,000 65.5
9,397,285
98
151
122
29 (19)
0.000561 152,884
TOTAL
19,853,000
12,670,881
875,110
May 2009–March 2010 (new unit purchase)
Air conditioner 2,668,000 52,4%
1,398,032
1193
1138
55 (5%)
0.000561 43,136
Refrigerator
2,838,000 29.4
834,372
377
343
34 (9)
0.000561 15,915
Television set 14,347,000 34.5
4,949,715
127
122
5 (4)
0.000561 13,884
TOTAL
19,853,000
7,182,119
72,935
April 2010–December 2010 (replacement purchase)
H. Hayami and M. Nakamura
Table 3.9 Reductions in greenhouse gas emissions (CO
2 equivalent): Japan’s Eco Policy experiments (2009–2011)
Number of
units
Replacements
purchased (%)
(rate of
recycling)
Replacements
purchased
(number)
Year
purchased
of old unit
Electric
power
consumed
old units/
year (KWH/
year)
Electric
power
consumed
new units/
year (KWH/
year)
Reductions
(%) in
electric
power used
Estimated
total CO
2
emissions
(tons/
KWH)
Reductions
in CO
2
emissions
(tons/year)
Total reduction
in CO
2
emissions
(tons)
May 2009–March 2010 (replacement purchase)
Air conditioner 2,668,000 47.6%
1,269,968
95
1396
1138
258 (18%) 0.000561 183,813
May 2009–
March 2010:
948045 tons
Refrigerator
2,838,000 70.6
2,003,628
95
822
343
479 (58)
0.000561 538,413
Television set 14,347,000 65.5
9,397,285
98
151
122
29 (19)
0.000561 152,884
TOTAL
19,853,000
12,670,881
875,110
May 2009–March 2010 (new unit purchase)
Air conditioner 2,668,000 52,4%
1,398,032
1193
1138
55 (5%)
0.000561 43,136
Refrigerator
2,838,000 29.4
834,372
377
343
34 (9)
0.000561 15,915
Television set 14,347,000 34.5
4,949,715
127
122
5 (4)
0.000561 13,884
TOTAL
19,853,000
7,182,119
72,935
April 2010–December 2010 (replacement purchase)
H. Hayami and M. Nakamura