

48
recycling costs observed in Japan for certain home and other appliances. Most of
these appliances were sold by large national appliance producers.
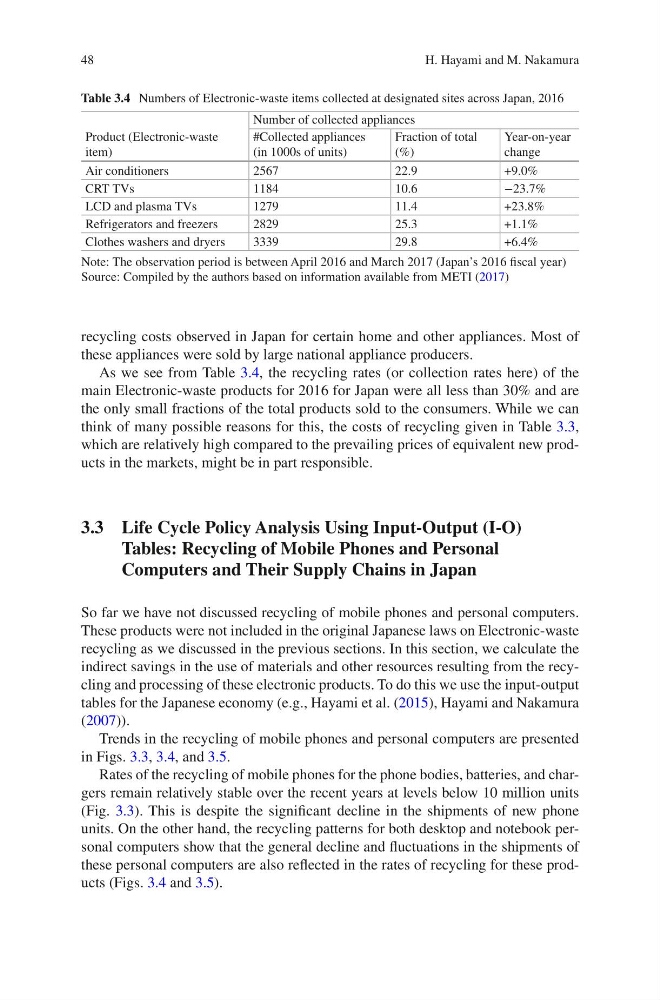
As we see from Table 3.4, the recycling rates (or collection rates here) of the
main Electronic-waste products for 2016 for Japan were all less than 30% and are
the only small fractions of the total products sold to the consumers. While we can
think of many possible reasons for this, the costs of recycling given in Table 3.3,
which are relatively high compared to the prevailing prices of equivalent new products in the markets, might be in part responsible.
3.3 Life Cycle Policy Analysis Using Input-Output (I-O)
Tables: Recycling of Mobile Phones and Personal
Computers and Their Supply Chains in Japan
So far we have not discussed recycling of mobile phones and personal computers.
These products were not included in the original Japanese laws on Electronic-waste
recycling as we discussed in the previous sections. In this section, we calculate the
indirect savings in the use of materials and other resources resulting from the recycling and processing of these electronic products. To do this we use the input-output
tables for the Japanese economy (e.g., Hayami et al. (2015), Hayami and Nakamura
(2007)).
Trends in the recycling of mobile phones and personal computers are presented
in Figs. 3.3, 3.4, and 3.5.
Rates of the recycling of mobile phones for the phone bodies, batteries, and chargers remain relatively stable over the recent years at levels below 10 million units
(Fig. 3.3). This is despite the significant decline in the shipments of new phone
units. On the other hand, the recycling patterns for both desktop and notebook personal computers show that the general decline and fluctuations in the shipments of
these personal computers are also reflected in the rates of recycling for these products (Figs. 3.4 and 3.5).
Table 3.4 Numbers of Electronic-waste items collected at designated sites across Japan, 2016
Number of collected appliances
Product (Electronic-waste
item)
#Collected appliances
(in 1000s of units)
Fraction of total
(%)
Year-on-year
change
Air conditioners
2567
22.9
+9.0%
CRT TVs
1184
10.6
−23.7%
LCD and plasma TVs
1279
11.4
+23.8%
Refrigerators and freezers
2829
25.3
+1.1%
Clothes washers and dryers
3339
29.8
+6.4%
Note: The observation period is between April 2016 and March 2017 (Japan’s 2016 fiscal year)
Source: Compiled by the authors based on information available from METI (2017)
H. Hayami and M. Nakamura
recycling costs observed in Japan for certain home and other appliances. Most of
these appliances were sold by large national appliance producers.
As we see from Table 3.4, the recycling rates (or collection rates here) of the
main Electronic-waste products for 2016 for Japan were all less than 30% and are
the only small fractions of the total products sold to the consumers. While we can
think of many possible reasons for this, the costs of recycling given in Table 3.3,
which are relatively high compared to the prevailing prices of equivalent new products in the markets, might be in part responsible.
3.3 Life Cycle Policy Analysis Using Input-Output (I-O)
Tables: Recycling of Mobile Phones and Personal
Computers and Their Supply Chains in Japan
So far we have not discussed recycling of mobile phones and personal computers.
These products were not included in the original Japanese laws on Electronic-waste
recycling as we discussed in the previous sections. In this section, we calculate the
indirect savings in the use of materials and other resources resulting from the recycling and processing of these electronic products. To do this we use the input-output
tables for the Japanese economy (e.g., Hayami et al. (2015), Hayami and Nakamura
(2007)).
Trends in the recycling of mobile phones and personal computers are presented
in Figs. 3.3, 3.4, and 3.5.
Rates of the recycling of mobile phones for the phone bodies, batteries, and chargers remain relatively stable over the recent years at levels below 10 million units
(Fig. 3.3). This is despite the significant decline in the shipments of new phone
units. On the other hand, the recycling patterns for both desktop and notebook personal computers show that the general decline and fluctuations in the shipments of
these personal computers are also reflected in the rates of recycling for these products (Figs. 3.4 and 3.5).
Table 3.4 Numbers of Electronic-waste items collected at designated sites across Japan, 2016
Number of collected appliances
Product (Electronic-waste
item)
#Collected appliances
(in 1000s of units)
Fraction of total
(%)
Year-on-year
change
Air conditioners
2567
22.9
+9.0%
CRT TVs
1184
10.6
−23.7%
LCD and plasma TVs
1279
11.4
+23.8%
Refrigerators and freezers
2829
25.3
+1.1%
Clothes washers and dryers
3339
29.8
+6.4%
Note: The observation period is between April 2016 and March 2017 (Japan’s 2016 fiscal year)
Source: Compiled by the authors based on information available from METI (2017)
H. Hayami and M. Nakamura