

135
that offers an estimation of the mean after discarding both tails of the distribution to
avoid outliers distortion. Moreover, we also provide violin plots for further interpretation of results. They include all features of the distribution and offer more thorough information on how the categories of WEEE behave. Specifically, Fig. 7.2
shows the violin plots for category A and the total aggregated amount of WEEE.
4
The results show that the mean technical efficiency score for all WEEE categories and all European countries is 1.063. It suggests that they are properly managing
WEEE but the total amount of EEE collected and treated for recovering and recycling could still be improved by 6.3%. However, if we compare the results yielded
by different countries, in general, they show several discrepancies.
Focusing on the best performing countries, we observe that only Germany presents an efficiency score of 1 for all the categories, i.e., it is always efficient.
Moreover, both Croatia and Malta are efficient for all the WEEE categories except
for category D, in which they are highly inefficient. Nevertheless, despite its very
poor management in this particular category, both countries are considered as quite
efficient units as a whole. This is due to this type of waste presents the minor weight
in terms of tons from the total aggregated set of WEEE. Finally, some countries
such as the Netherlands and Finland present some room for improvement in most of
the categories, but they are efficient when regarding the total WEEE. In contrast,
Iceland and Lithuania are the worst performing countries given their high inefficiency
4 For visual simplicity, we only plot the total aggregated amount of WEEE together with category
A, which is the most important category of WEEE in terms of tones; however, individual plots for
the rest of categories are available upon request.
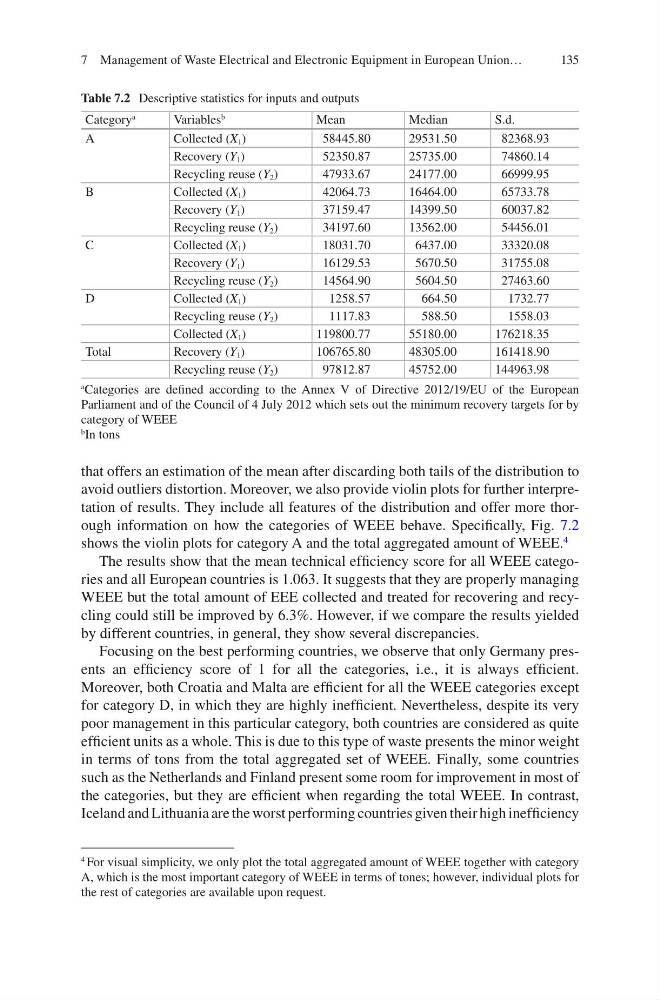
Table 7.2 Descriptive statistics for inputs and outputs
Category
a
Variables
b
Mean
Median
S.d.
A
Collected (X 1 )
58445.80
29531.50
82368.93
Recovery (Y 1 )
52350.87
25735.00
74860.14
Recycling reuse (Y 2 )
47933.67
24177.00
66999.95
B
Collected (X 1 )
42064.73
16464.00
65733.78
Recovery (Y 1 )
37159.47
14399.50
60037.82
Recycling reuse (Y 2 )
34197.60
13562.00
54456.01
C
Collected (X 1 )
18031.70
6437.00
33320.08
Recovery (Y 1 )
16129.53
5670.50
31755.08
Recycling reuse (Y 2 )
14564.90
5604.50
27463.60
D
Collected (X 1 )
1258.57
664.50
1732.77
Recycling reuse (Y 2 )
1117.83
588.50
1558.03
Collected (X 1 )
119800.77
55180.00
176218.35
Total
Recovery (Y 1 )
106765.80
48305.00
161418.90
Recycling reuse (Y 2 )
97812.87
45752.00
144963.98
a
Categories are defined according to the Annex V of Directive 2012/19/EU of the European
Parliament and of the Council of 4 July 2012 which sets out the minimum recovery targets for by
category of WEEE
b
In tons
7 Management of Waste Electrical and Electronic Equipment in European Union…
that offers an estimation of the mean after discarding both tails of the distribution to
avoid outliers distortion. Moreover, we also provide violin plots for further interpretation of results. They include all features of the distribution and offer more thorough information on how the categories of WEEE behave. Specifically, Fig. 7.2
shows the violin plots for category A and the total aggregated amount of WEEE.
4
The results show that the mean technical efficiency score for all WEEE categories and all European countries is 1.063. It suggests that they are properly managing
WEEE but the total amount of EEE collected and treated for recovering and recycling could still be improved by 6.3%. However, if we compare the results yielded
by different countries, in general, they show several discrepancies.
Focusing on the best performing countries, we observe that only Germany presents an efficiency score of 1 for all the categories, i.e., it is always efficient.
Moreover, both Croatia and Malta are efficient for all the WEEE categories except
for category D, in which they are highly inefficient. Nevertheless, despite its very
poor management in this particular category, both countries are considered as quite
efficient units as a whole. This is due to this type of waste presents the minor weight
in terms of tons from the total aggregated set of WEEE. Finally, some countries
such as the Netherlands and Finland present some room for improvement in most of
the categories, but they are efficient when regarding the total WEEE. In contrast,
Iceland and Lithuania are the worst performing countries given their high inefficiency
4 For visual simplicity, we only plot the total aggregated amount of WEEE together with category
A, which is the most important category of WEEE in terms of tones; however, individual plots for
the rest of categories are available upon request.
Table 7.2 Descriptive statistics for inputs and outputs
Category
a
Variables
b
Mean
Median
S.d.
A
Collected (X 1 )
58445.80
29531.50
82368.93
Recovery (Y 1 )
52350.87
25735.00
74860.14
Recycling reuse (Y 2 )
47933.67
24177.00
66999.95
B
Collected (X 1 )
42064.73
16464.00
65733.78
Recovery (Y 1 )
37159.47
14399.50
60037.82
Recycling reuse (Y 2 )
34197.60
13562.00
54456.01
C
Collected (X 1 )
18031.70
6437.00
33320.08
Recovery (Y 1 )
16129.53
5670.50
31755.08
Recycling reuse (Y 2 )
14564.90
5604.50
27463.60
D
Collected (X 1 )
1258.57
664.50
1732.77
Recycling reuse (Y 2 )
1117.83
588.50
1558.03
Collected (X 1 )
119800.77
55180.00
176218.35
Total
Recovery (Y 1 )
106765.80
48305.00
161418.90
Recycling reuse (Y 2 )
97812.87
45752.00
144963.98
a
Categories are defined according to the Annex V of Directive 2012/19/EU of the European
Parliament and of the Council of 4 July 2012 which sets out the minimum recovery targets for by
category of WEEE
b
In tons
7 Management of Waste Electrical and Electronic Equipment in European Union…