

4 The Analysis of Event-Related Potentials
71
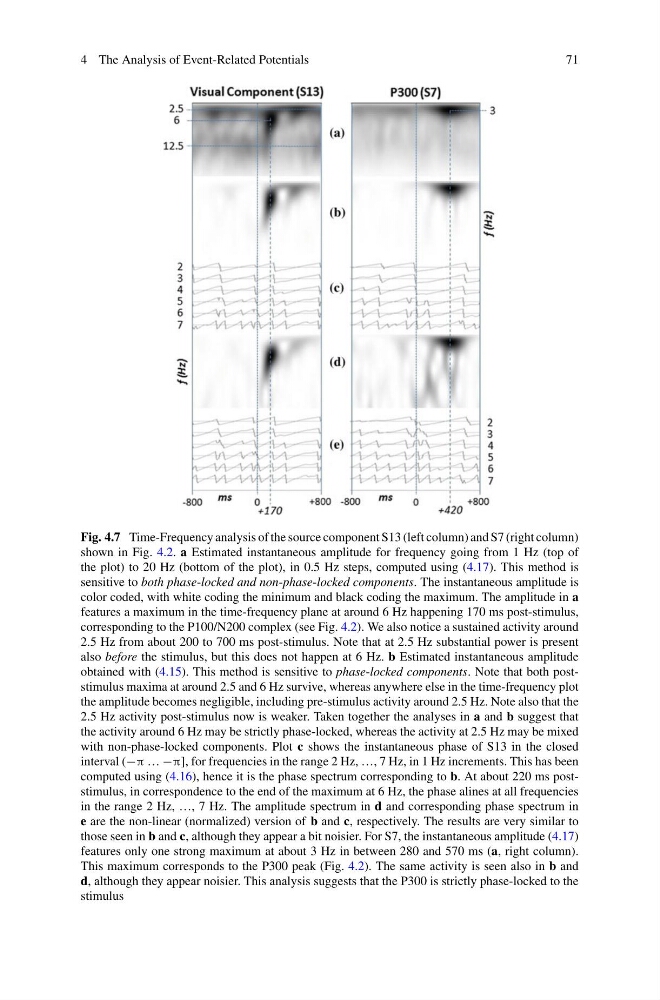
Fig. 4.7 Time-Frequency analysis of the source component S13 (left column) and S7 (right column)
shown in Fig. 4.2. a Estimated instantaneous amplitude for frequency going from 1 Hz (top of
the plot) to 20 Hz (bottom of the plot), in 0.5 Hz steps, computed using (4.17). This method is
sensitive to both phase-locked and non-phase-locked components. The instantaneous amplitude is
color coded, with white coding the minimum and black coding the maximum. The amplitude in a
features a maximum in the time-frequency plane at around 6 Hz happening 170 ms post-stimulus,
corresponding to the P100/N200 complex (see Fig. 4.2). We also notice a sustained activity around
2.5 Hz from about 200 to 700 ms post-stimulus. Note that at 2.5 Hz substantial power is present
also before the stimulus, but this does not happen at 6 Hz. b Estimated instantaneous amplitude
obtained with (4.15). This method is sensitive to phase-locked components. Note that both poststimulus maxima at around 2.5 and 6 Hz survive, whereas anywhere else in the time-frequency plot
the amplitude becomes negligible, including pre-stimulus activity around 2.5 Hz. Note also that the
2.5 Hz activity post-stimulus now is weaker. Taken together the analyses in a and b suggest that
the activity around 6 Hz may be strictly phase-locked, whereas the activity at 2.5 Hz may be mixed
with non-phase-locked components. Plot c shows the instantaneous phase of S13 in the closed
interval (−π … −π], for frequencies in the range 2 Hz, …, 7 Hz, in 1 Hz increments. This has been
computed using (4.16), hence it is the phase spectrum corresponding to b. At about 220 ms poststimulus, in correspondence to the end of the maximum at 6 Hz, the phase alines at all frequencies
in the range 2 Hz, …, 7 Hz. The amplitude spectrum in d and corresponding phase spectrum in
e are the non-linear (normalized) version of b and c, respectively. The results are very similar to
those seen in b and c, although they appear a bit noisier. For S7, the instantaneous amplitude (4.17)
features only one strong maximum at about 3 Hz in between 280 and 570 ms (a, right column).
This maximum corresponds to the P300 peak (Fig. 4.2). The same activity is seen also in b and
d, although they appear noisier. This analysis suggests that the P300 is strictly phase-locked to the
stimulus
71
Fig. 4.7 Time-Frequency analysis of the source component S13 (left column) and S7 (right column)
shown in Fig. 4.2. a Estimated instantaneous amplitude for frequency going from 1 Hz (top of
the plot) to 20 Hz (bottom of the plot), in 0.5 Hz steps, computed using (4.17). This method is
sensitive to both phase-locked and non-phase-locked components. The instantaneous amplitude is
color coded, with white coding the minimum and black coding the maximum. The amplitude in a
features a maximum in the time-frequency plane at around 6 Hz happening 170 ms post-stimulus,
corresponding to the P100/N200 complex (see Fig. 4.2). We also notice a sustained activity around
2.5 Hz from about 200 to 700 ms post-stimulus. Note that at 2.5 Hz substantial power is present
also before the stimulus, but this does not happen at 6 Hz. b Estimated instantaneous amplitude
obtained with (4.15). This method is sensitive to phase-locked components. Note that both poststimulus maxima at around 2.5 and 6 Hz survive, whereas anywhere else in the time-frequency plot
the amplitude becomes negligible, including pre-stimulus activity around 2.5 Hz. Note also that the
2.5 Hz activity post-stimulus now is weaker. Taken together the analyses in a and b suggest that
the activity around 6 Hz may be strictly phase-locked, whereas the activity at 2.5 Hz may be mixed
with non-phase-locked components. Plot c shows the instantaneous phase of S13 in the closed
interval (−π … −π], for frequencies in the range 2 Hz, …, 7 Hz, in 1 Hz increments. This has been
computed using (4.16), hence it is the phase spectrum corresponding to b. At about 220 ms poststimulus, in correspondence to the end of the maximum at 6 Hz, the phase alines at all frequencies
in the range 2 Hz, …, 7 Hz. The amplitude spectrum in d and corresponding phase spectrum in
e are the non-linear (normalized) version of b and c, respectively. The results are very similar to
those seen in b and c, although they appear a bit noisier. For S7, the instantaneous amplitude (4.17)
features only one strong maximum at about 3 Hz in between 280 and 570 ms (a, right column).
This maximum corresponds to the P300 peak (Fig. 4.2). The same activity is seen also in b and
d, although they appear noisier. This analysis suggests that the P300 is strictly phase-locked to the
stimulus