

3 EEG Spectral Analysis
49
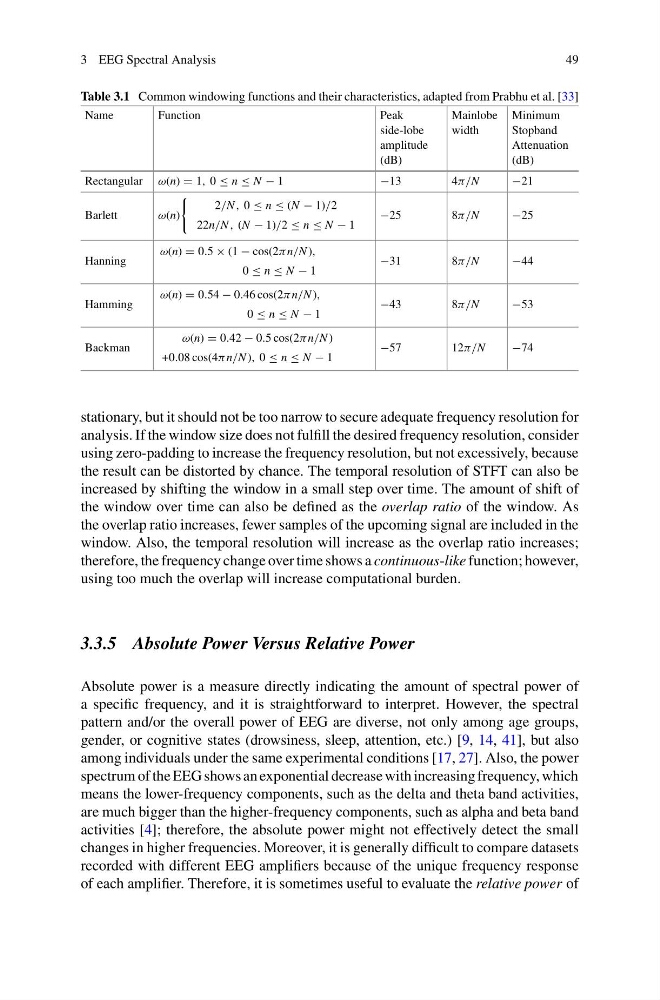
Table 3.1 Common windowing functions and their characteristics, adapted from Prabhu et al. [33]
Name
Function
Peak
side-lobe
amplitude
(dB)
Mainlobe
width
Minimum
Stopband
Attenuation
(dB)
Rectangular ω(n) 1, 0 ≤ n ≤ N − 1
−13
4π/N
−21
Barlett
ω(n)
2/N , 0 ≤ n ≤ (N − 1)/2
22n/N , (N − 1)/2 ≤ n ≤ N − 1
−25
8π/N
−25
Hanning
ω(n) 0.5 × (1 − cos(2π n/N ),
0 ≤ n ≤ N − 1
−31
8π/N
−44
Hamming
ω(n) 0.54 − 0.46 cos(2π n/N ),
0 ≤ n ≤ N − 1
−43
8π/N
−53
Backman
ω(n) 0.42 − 0.5 cos(2π n/N )
+0.08 cos(4π n/N ), 0 ≤ n ≤ N − 1
−57
12π/N
−74
stationary, but it should not be too narrow to secure adequate frequency resolution for
analysis. If the window size does not fulfill the desired frequency resolution, consider
using zero-padding to increase the frequency resolution, but not excessively, because
the result can be distorted by chance. The temporal resolution of STFT can also be
increased by shifting the window in a small step over time. The amount of shift of
the window over time can also be defined as the overlap ratio of the window. As
the overlap ratio increases, fewer samples of the upcoming signal are included in the
window. Also, the temporal resolution will increase as the overlap ratio increases;
therefore, the frequency change over time shows a continuous-like function; however,
using too much the overlap will increase computational burden.
3.3.5 Absolute Power Versus Relative Power
Absolute power is a measure directly indicating the amount of spectral power of
a specific frequency, and it is straightforward to interpret. However, the spectral
pattern and/or the overall power of EEG are diverse, not only among age groups,
gender, or cognitive states (drowsiness, sleep, attention, etc.) [9, 14, 41], but also
among individuals under the same experimental conditions [17, 27]. Also, the power
spectrum of the EEG shows an exponential decrease with increasing frequency, which
means the lower-frequency components, such as the delta and theta band activities,
are much bigger than the higher-frequency components, such as alpha and beta band
activities [4]; therefore, the absolute power might not effectively detect the small
changes in higher frequencies. Moreover, it is generally difficult to compare datasets
recorded with different EEG amplifiers because of the unique frequency response
of each amplifier. Therefore, it is sometimes useful to evaluate the relative power of
49
Table 3.1 Common windowing functions and their characteristics, adapted from Prabhu et al. [33]
Name
Function
Peak
side-lobe
amplitude
(dB)
Mainlobe
width
Minimum
Stopband
Attenuation
(dB)
Rectangular ω(n) 1, 0 ≤ n ≤ N − 1
−13
4π/N
−21
Barlett
ω(n)
2/N , 0 ≤ n ≤ (N − 1)/2
22n/N , (N − 1)/2 ≤ n ≤ N − 1
−25
8π/N
−25
Hanning
ω(n) 0.5 × (1 − cos(2π n/N ),
0 ≤ n ≤ N − 1
−31
8π/N
−44
Hamming
ω(n) 0.54 − 0.46 cos(2π n/N ),
0 ≤ n ≤ N − 1
−43
8π/N
−53
Backman
ω(n) 0.42 − 0.5 cos(2π n/N )
+0.08 cos(4π n/N ), 0 ≤ n ≤ N − 1
−57
12π/N
−74
stationary, but it should not be too narrow to secure adequate frequency resolution for
analysis. If the window size does not fulfill the desired frequency resolution, consider
using zero-padding to increase the frequency resolution, but not excessively, because
the result can be distorted by chance. The temporal resolution of STFT can also be
increased by shifting the window in a small step over time. The amount of shift of
the window over time can also be defined as the overlap ratio of the window. As
the overlap ratio increases, fewer samples of the upcoming signal are included in the
window. Also, the temporal resolution will increase as the overlap ratio increases;
therefore, the frequency change over time shows a continuous-like function; however,
using too much the overlap will increase computational burden.
3.3.5 Absolute Power Versus Relative Power
Absolute power is a measure directly indicating the amount of spectral power of
a specific frequency, and it is straightforward to interpret. However, the spectral
pattern and/or the overall power of EEG are diverse, not only among age groups,
gender, or cognitive states (drowsiness, sleep, attention, etc.) [9, 14, 41], but also
among individuals under the same experimental conditions [17, 27]. Also, the power
spectrum of the EEG shows an exponential decrease with increasing frequency, which
means the lower-frequency components, such as the delta and theta band activities,
are much bigger than the higher-frequency components, such as alpha and beta band
activities [4]; therefore, the absolute power might not effectively detect the small
changes in higher frequencies. Moreover, it is generally difficult to compare datasets
recorded with different EEG amplifiers because of the unique frequency response
of each amplifier. Therefore, it is sometimes useful to evaluate the relative power of