

7 Computational EEG Analysis for the Diagnosis of Psychiatric …
163
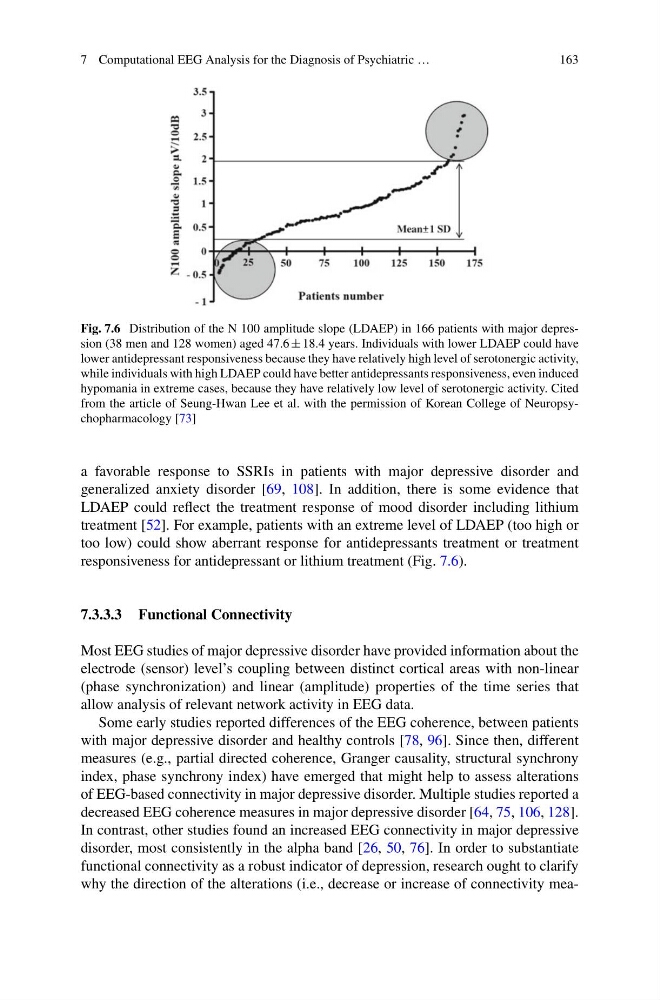
Fig. 7.6 Distribution of the N 100 amplitude slope (LDAEP) in 166 patients with major depression (38 men and 128 women) aged 47.6 ± 18.4 years. Individuals with lower LDAEP could have
lower antidepressant responsiveness because they have relatively high level of serotonergic activity,
while individuals with high LDAEP could have better antidepressants responsiveness, even induced
hypomania in extreme cases, because they have relatively low level of serotonergic activity. Cited
from the article of Seung-Hwan Lee et al. with the permission of Korean College of Neuropsychopharmacology [73]
a favorable response to SSRIs in patients with major depressive disorder and
generalized anxiety disorder [69, 108]. In addition, there is some evidence that
LDAEP could reflect the treatment response of mood disorder including lithium
treatment [52]. For example, patients with an extreme level of LDAEP (too high or
too low) could show aberrant response for antidepressants treatment or treatment
responsiveness for antidepressant or lithium treatment (Fig. 7.6).
7.3.3.3 Functional Connectivity
Most EEG studies of major depressive disorder have provided information about the
electrode (sensor) level’s coupling between distinct cortical areas with non-linear
(phase synchronization) and linear (amplitude) properties of the time series that
allow analysis of relevant network activity in EEG data.
Some early studies reported differences of the EEG coherence, between patients
with major depressive disorder and healthy controls [78, 96]. Since then, different
measures (e.g., partial directed coherence, Granger causality, structural synchrony
index, phase synchrony index) have emerged that might help to assess alterations
of EEG-based connectivity in major depressive disorder. Multiple studies reported a
decreased EEG coherence measures in major depressive disorder [64, 75, 106, 128].
In contrast, other studies found an increased EEG connectivity in major depressive
disorder, most consistently in the alpha band [26, 50, 76]. In order to substantiate
functional connectivity as a robust indicator of depression, research ought to clarify
why the direction of the alterations (i.e., decrease or increase of connectivity mea-
163
Fig. 7.6 Distribution of the N 100 amplitude slope (LDAEP) in 166 patients with major depression (38 men and 128 women) aged 47.6 ± 18.4 years. Individuals with lower LDAEP could have
lower antidepressant responsiveness because they have relatively high level of serotonergic activity,
while individuals with high LDAEP could have better antidepressants responsiveness, even induced
hypomania in extreme cases, because they have relatively low level of serotonergic activity. Cited
from the article of Seung-Hwan Lee et al. with the permission of Korean College of Neuropsychopharmacology [73]
a favorable response to SSRIs in patients with major depressive disorder and
generalized anxiety disorder [69, 108]. In addition, there is some evidence that
LDAEP could reflect the treatment response of mood disorder including lithium
treatment [52]. For example, patients with an extreme level of LDAEP (too high or
too low) could show aberrant response for antidepressants treatment or treatment
responsiveness for antidepressant or lithium treatment (Fig. 7.6).
7.3.3.3 Functional Connectivity
Most EEG studies of major depressive disorder have provided information about the
electrode (sensor) level’s coupling between distinct cortical areas with non-linear
(phase synchronization) and linear (amplitude) properties of the time series that
allow analysis of relevant network activity in EEG data.
Some early studies reported differences of the EEG coherence, between patients
with major depressive disorder and healthy controls [78, 96]. Since then, different
measures (e.g., partial directed coherence, Granger causality, structural synchrony
index, phase synchrony index) have emerged that might help to assess alterations
of EEG-based connectivity in major depressive disorder. Multiple studies reported a
decreased EEG coherence measures in major depressive disorder [64, 75, 106, 128].
In contrast, other studies found an increased EEG connectivity in major depressive
disorder, most consistently in the alpha band [26, 50, 76]. In order to substantiate
functional connectivity as a robust indicator of depression, research ought to clarify
why the direction of the alterations (i.e., decrease or increase of connectivity mea-